More than just weather: how climate shapes life in Washington, D.C., and the Galapagos
Put any meteorologist or scientist on the spot and ask them to define the climate in 10 seconds or less, they will blurt out some variation of “climate is the average of weather” (I’m guilty of this!). And, while it’s true in a narrow sense, it doesn’t provide a complete picture. We can’t expect to fully understand—much less predict—a location’s climate just by averaging its day-to-day weather. Let me explain by comparing the climates of Washington, D.C. and the Galapagos Islands.
In the mid-latitudes, summer is still ahead, but in the Galapagos Islands, the hottest days of the year have already arrived. NOAA Climate.gov cartoon.
In Washington, D.C., we are in the midst of spring. The tulips are out, the trees and grass are bright green, the pollen is smothering, and while there are still a few crisp, cool mornings, everyone knows winter is over and summer is ahead. It’s a different situation in the Galapagos Islands, which are located thousands of miles away in the eastern equatorial Pacific Ocean. There, the island’s famous giant tortoises are already in the midst of summer. Not coincidentally, March is the time of year when the surrounding sea surface temperatures are the warmest of the year.
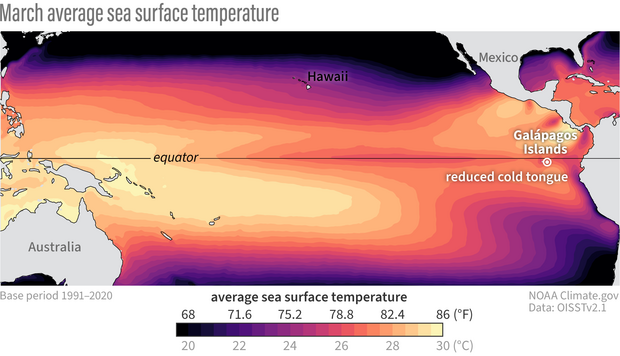
Average sea surface temperatures during March over the 1991-2020 period. Darker shading indicates comparatively cooler temperatures and brighter shading indicates warmer temperatures. Map by Climate.gov based on analysis by M. L'Heureux.
While D.C. residents are breathing a sigh of relief to be done with the winter, the tortoises of the Galapagos may already be seeking shade and eager for things to cool down. Luckily, for any overheated turtles, “winter” in the Galapagos is not too far off. The cold water that typically upwells off the coast of South America has slowed, but it’s on the cusp of a resurgence. As we advance toward September, the so-called “cold tongue” of water will strengthen and expand westward in response to the region’s prevailing easterly (from the east) winds.
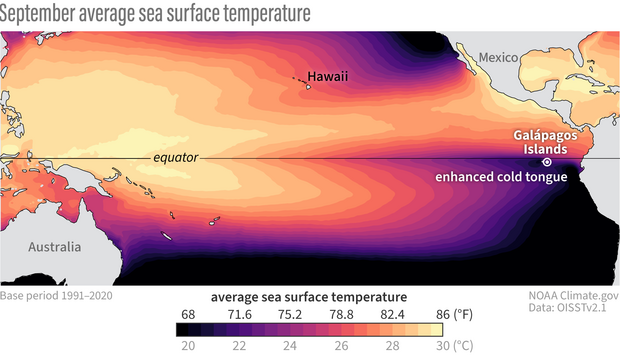
Average sea surface temperatures during September over the 1991-2020 period. Darker shading indicates comparatively cooler temperatures and brighter shading indicates warmer temperatures. Map by Climate.gov based on analysis by M. L'Heureux.
Weather maker
While the seasons in the Galapagos are dictated by the island’s closeness to the cold tongue, El Niño and La Niña are the primary weather makers in the Galapagos. The surface air temperature in the Galapagos tends to be warmer during El Niño and cooler during La Niña. One can see this from the time series below (left panel): in early 2024, a strong El Niño boosted their air temperatures (pink shading) and the gradual slide toward La Niña cooled them down (blue shading).
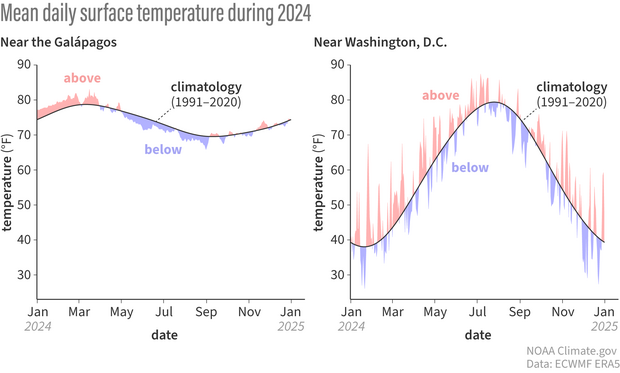
Average daily surface (2-meter) temperature during 2024 (in shading) and for the 1991-2020 climatology (black curve). Daily averages are formed by averaging 0, 6, 12, 18 UTC (coordinated universal time) hourly data. The climatology curve is smoothed using the first three harmonics. Graphs by Climate.gov based on analysis by M. L'Heureux.
For Washington, D.C., the seasonal climate and the weather look vastly different from that over the Galapagos. The weather, or day-to-day changes, are highly variable and chaotic, reflecting the motions of fast-moving weather systems traversing the United States (these sorts of systems do not occur in the deep Tropics). In the right panel of the plot above, the average (or mean) daily temperature for D.C. is shown during 2024, with above-average days in red and below-average days in blue. Comparing it to the Galapagos time series, notice how different the range of temperatures is on the y-axis, with DC spanning around 60 degrees Fahrenheit (34 degrees Celsius) and the Galapagos less than 20°F (11°C).
In the graphs above, you’ll also notice the smooth black line between the warmer-than-average days and cooler days. The smooth line shows the average climate, or climatology, for each day of the year, created by averaging the temperature for each day over 30 years. Essentially, I averaged together “the weather” that occurred on each calendar day to produce this climatology. But, does this average of the weather tell us everything we’d want to know about each location’s climate? The answer is “no;” let me explain.
Climate sources
Let’s step back: Why does the D.C. climatology tend to range between the upper 30s to almost 80°F? In D.C. why is the peak in July and the minimum in January? What exactly determines the timing of the seasons and their amplitude, or how much the temperature swings between them? The answer doesn’t lie in the chaotic swirls of weather systems moving across North America from day to day, nor in El Niño and La Niña. We have to look beyond the weather for an explanation.
In Washington, D.C., there is no equatorial cold tongue (or, perhaps more disappointingly, large tortoises) as is the case for the Galapagos. In D.C., and many other cities that lie within the middle latitudes, the timing of the solar cycle mostly determines when the seasons occur. As a result of the tilt of Earth’s axis, more incoming solar radiation (a phrase that we shorten to “insolation”) results in higher temperatures in D.C. in the summer; less insolation leads to colder temperatures in the winter. However, the precise timing of the seasons and actual range of temperatures is determined by other factors in our Earth system.
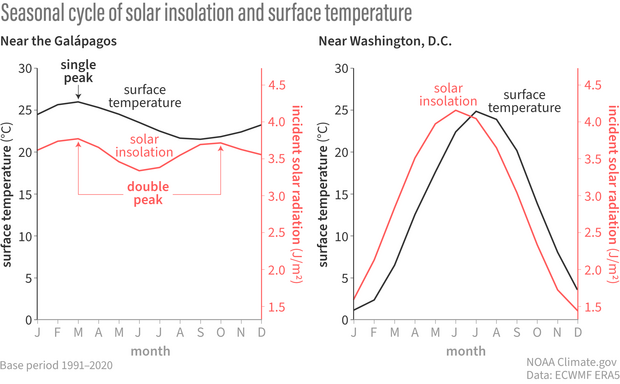
Average monthly surface (2-meter) temperature over the 1991-2020 period (black line) and average monthly incident solar radiation at the top of the atmosphere (red line). The values for solar radiation are divided by 10e7. Graphs by Cimate.gov based on analysis by M. L'Heureux.
While the solar cycle mostly describes the timing of the seasonal cycle in D.C., there is a slight lag, with the temperature maximum and minimum occurring roughly 1 month after solar insolation reaches its max/min. This lag is partially due to the closeness of the D.C. region to the Atlantic Ocean. Ocean water has a lot of thermal inertia (how quickly something changes its temperature), so it doesn’t warm up and cool down as quickly as air temperature. The land and atmosphere also don’t respond immediately to changes in solar insolation and it takes time for surface temperatures to change.
If we step back and look around, there are many additional factors that can determine the seasonal climate in any given place, such as average cloud cover extent (which can cool or warm depending on cloud type), altitude (generally cooler in the mountains), and the land surface (e.g., icy tundra, leafy forest, built urban city). And of course, if we step way, way back, the composition of gases in the atmosphere matters most of all: without them, Earth would be freezing!
What we recognize as “the climate” is shaped by the balance, or equilibrium, between many different parts of the Earth system that push it to be warmer or cooler. In the Galapagos, the movement of the oceanic cold tongue primarily determines the timing of their “winter” and “summer,” but what causes the shifts in the cold tongue? Unlike in D.C., the seasonal cycle of temperature is not strongly tied to the amount of incoming solar radiation (and solar insolation varies much less compared to D.C.). Check out how different the curves look for the two locations in the figure above!
So, what accounts for these differences? In the eastern equatorial Pacific Ocean, there is a complex interplay between the trajectory and strength of the winds blowing across the sea surface, the intensity of the cold water upwelling off coastal South America, shifts in the Intertropical convergence zone (a band of thunderstorms and heavy rainfall that generally sits north of the equator, but swings toward the equator in February-April), the presence of stratocumulus cloud decks, and fog (called the Garúa). The combination of these features overrides the influence of solar insolation and ultimately sets the amplitude and timing of the Galapagos’ seasonal temperature cycle. Because of the considerable influence of the surrounding ocean, the day-to-day weather changes are also slower and less variable, with smaller ups and downs, compared to the daily temperature changes in Washington, D.C.
Weather & climate together
What I am saying, then, is that weather and climate go hand in hand. Any change to the Earth system—its ocean, atmosphere, or land, and how they interact—will modify the climate. The climate’s amplitude and seasonality then, in turn, helps to set the range and tempo of the weather. So whenever someone says “Climate is just the average of weather,” don't forget to ask them what determines the rhythms and intensity of the climate. And remember the answer would be very different depending on whether you’re in the Galapagos or Washington D.C.
Acknowledgement: Thanks to conversations with Eric DeWeaver (National Science Foundation), which helped to motivate this article.
Comments
I am very displeased with humanity
Get it together, humans! Your're killing the planet! We must act to save our only home!
Feedback
I think this article provides a fantastic discussion on the nuances of local climate, and it’s a great resource for those beyond the basics. However, we need a major push to educate the general public on the reality of global climate change. Every day, whether through social media or comments/policies from powerful politicians, I’m reminded of a fundamental lack of understanding about how our emissions are clearly contributing to the increase in global temperatures, both in the air and in our oceans. Addressing this national information gap is critical, and once we can achieve that, we’ll be better equipped to tackle these finer, more specialized topics. Please continue pushing for greater education at the foundational level for the future of our country!
Add new comment