
Image caption
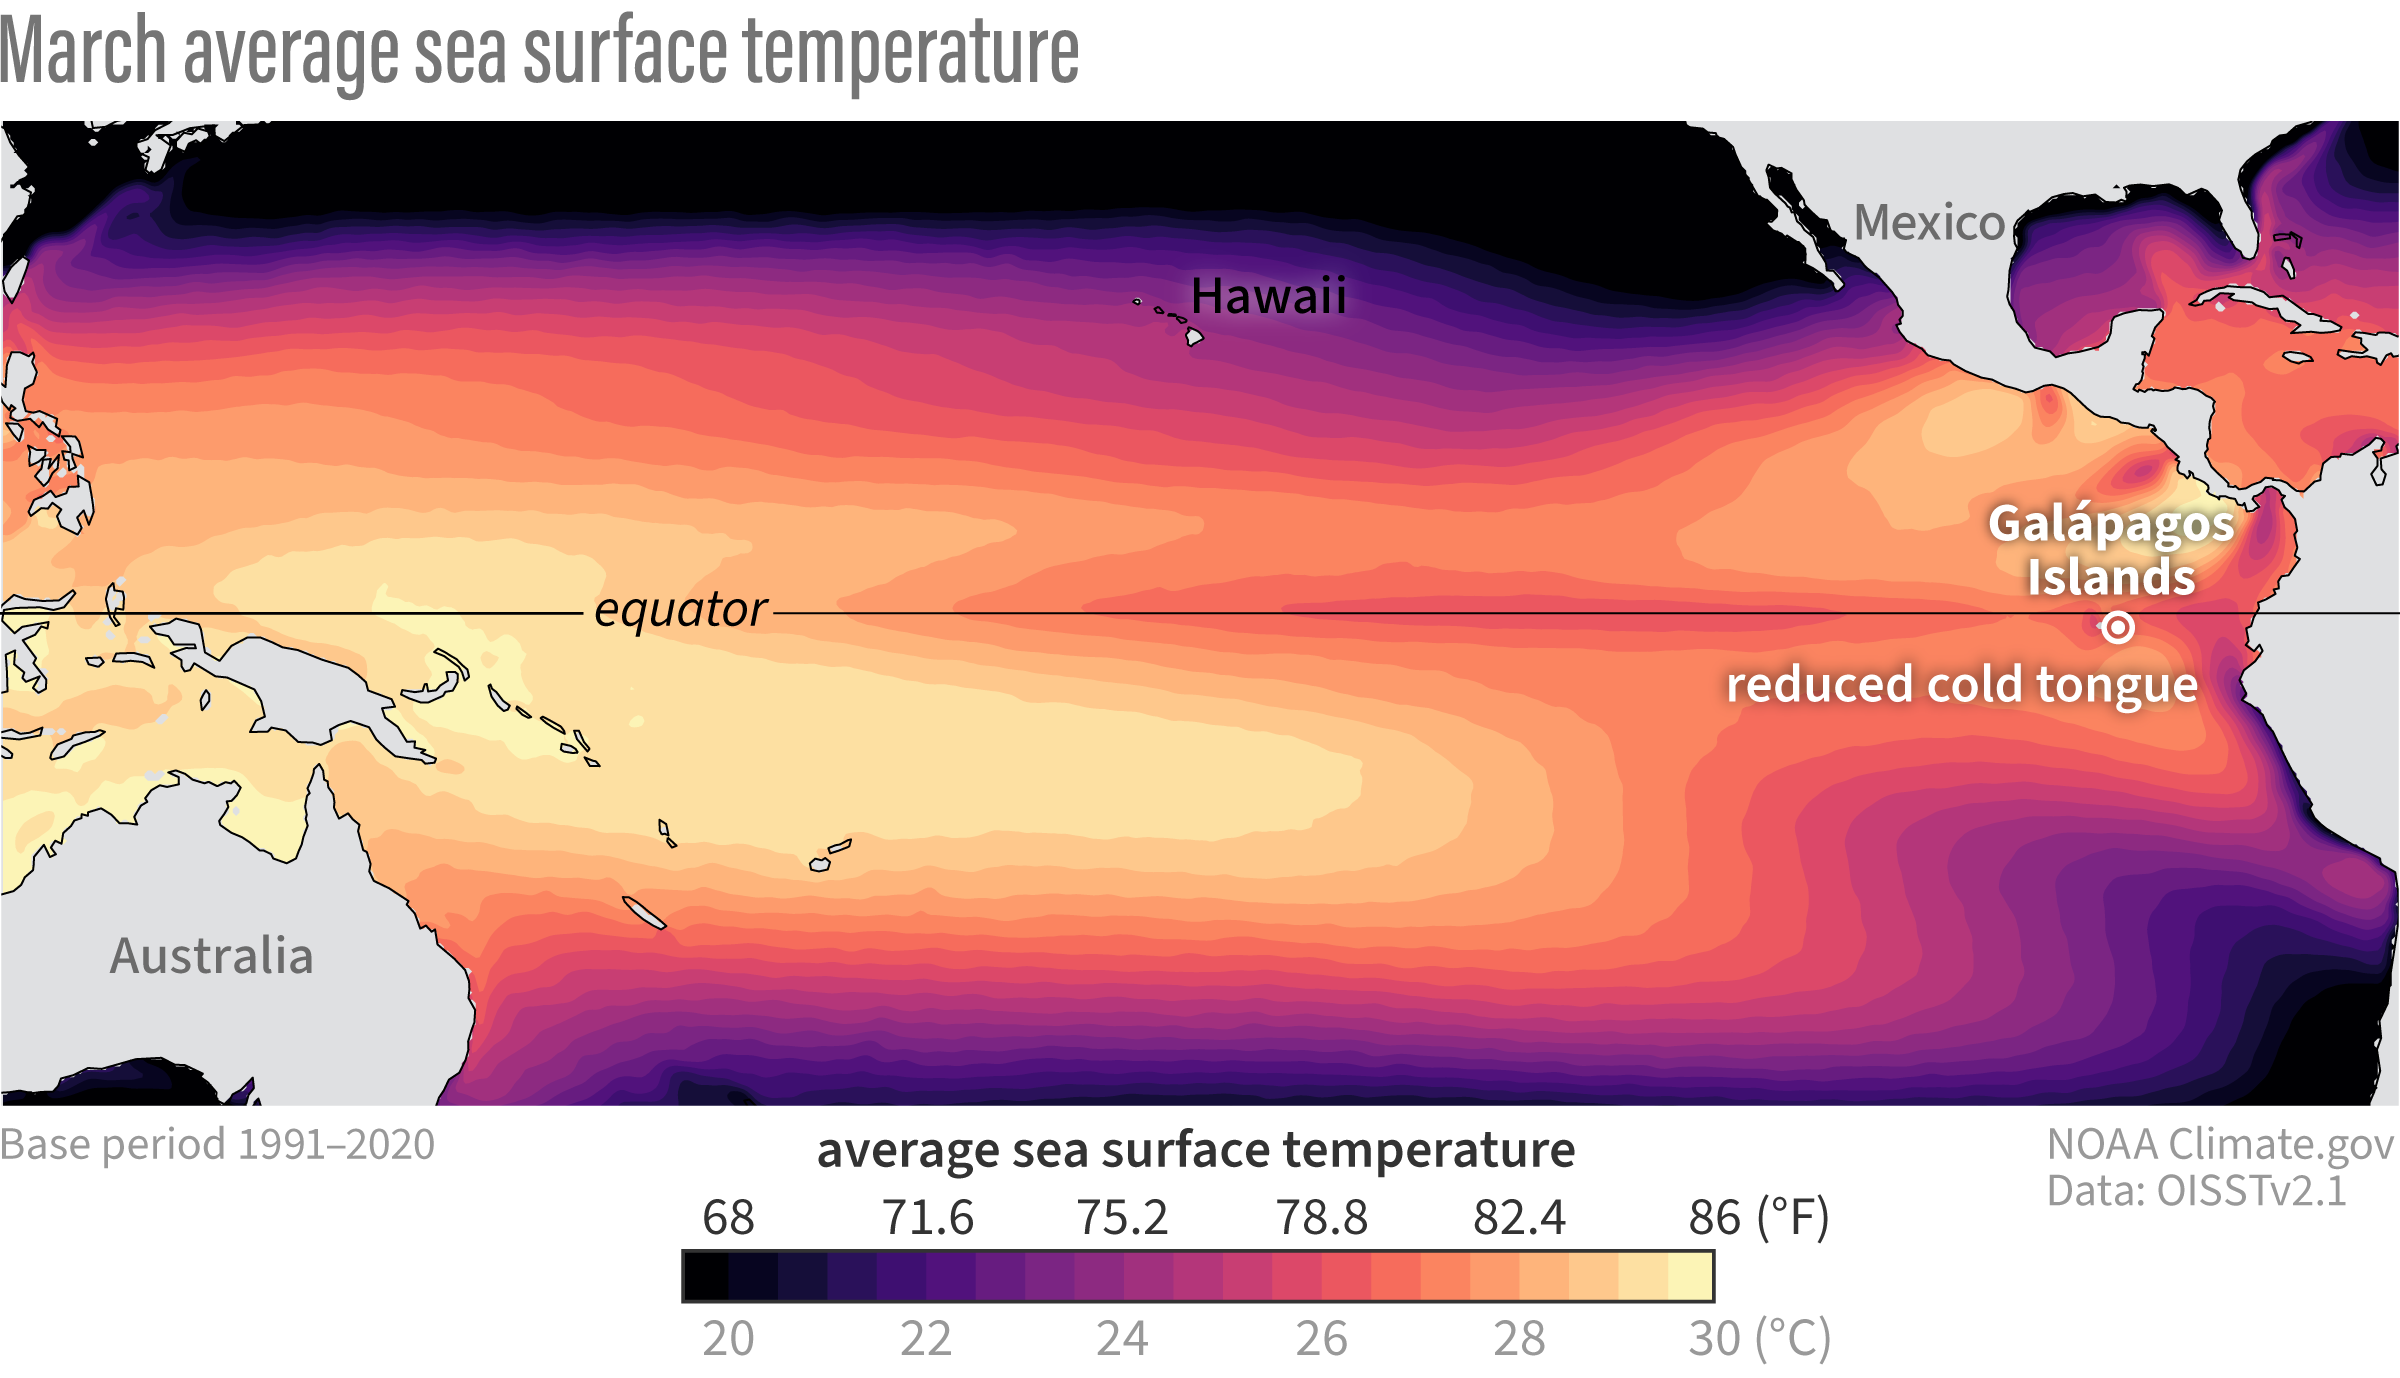
Average sea surface temperatures during March over the 1991-2020 period. Darker shading indicates comparatively cooler temperatures and brighter shading indicates warmer temperatures. Map by Climate.gov based on analysis by M. L'Heureux.