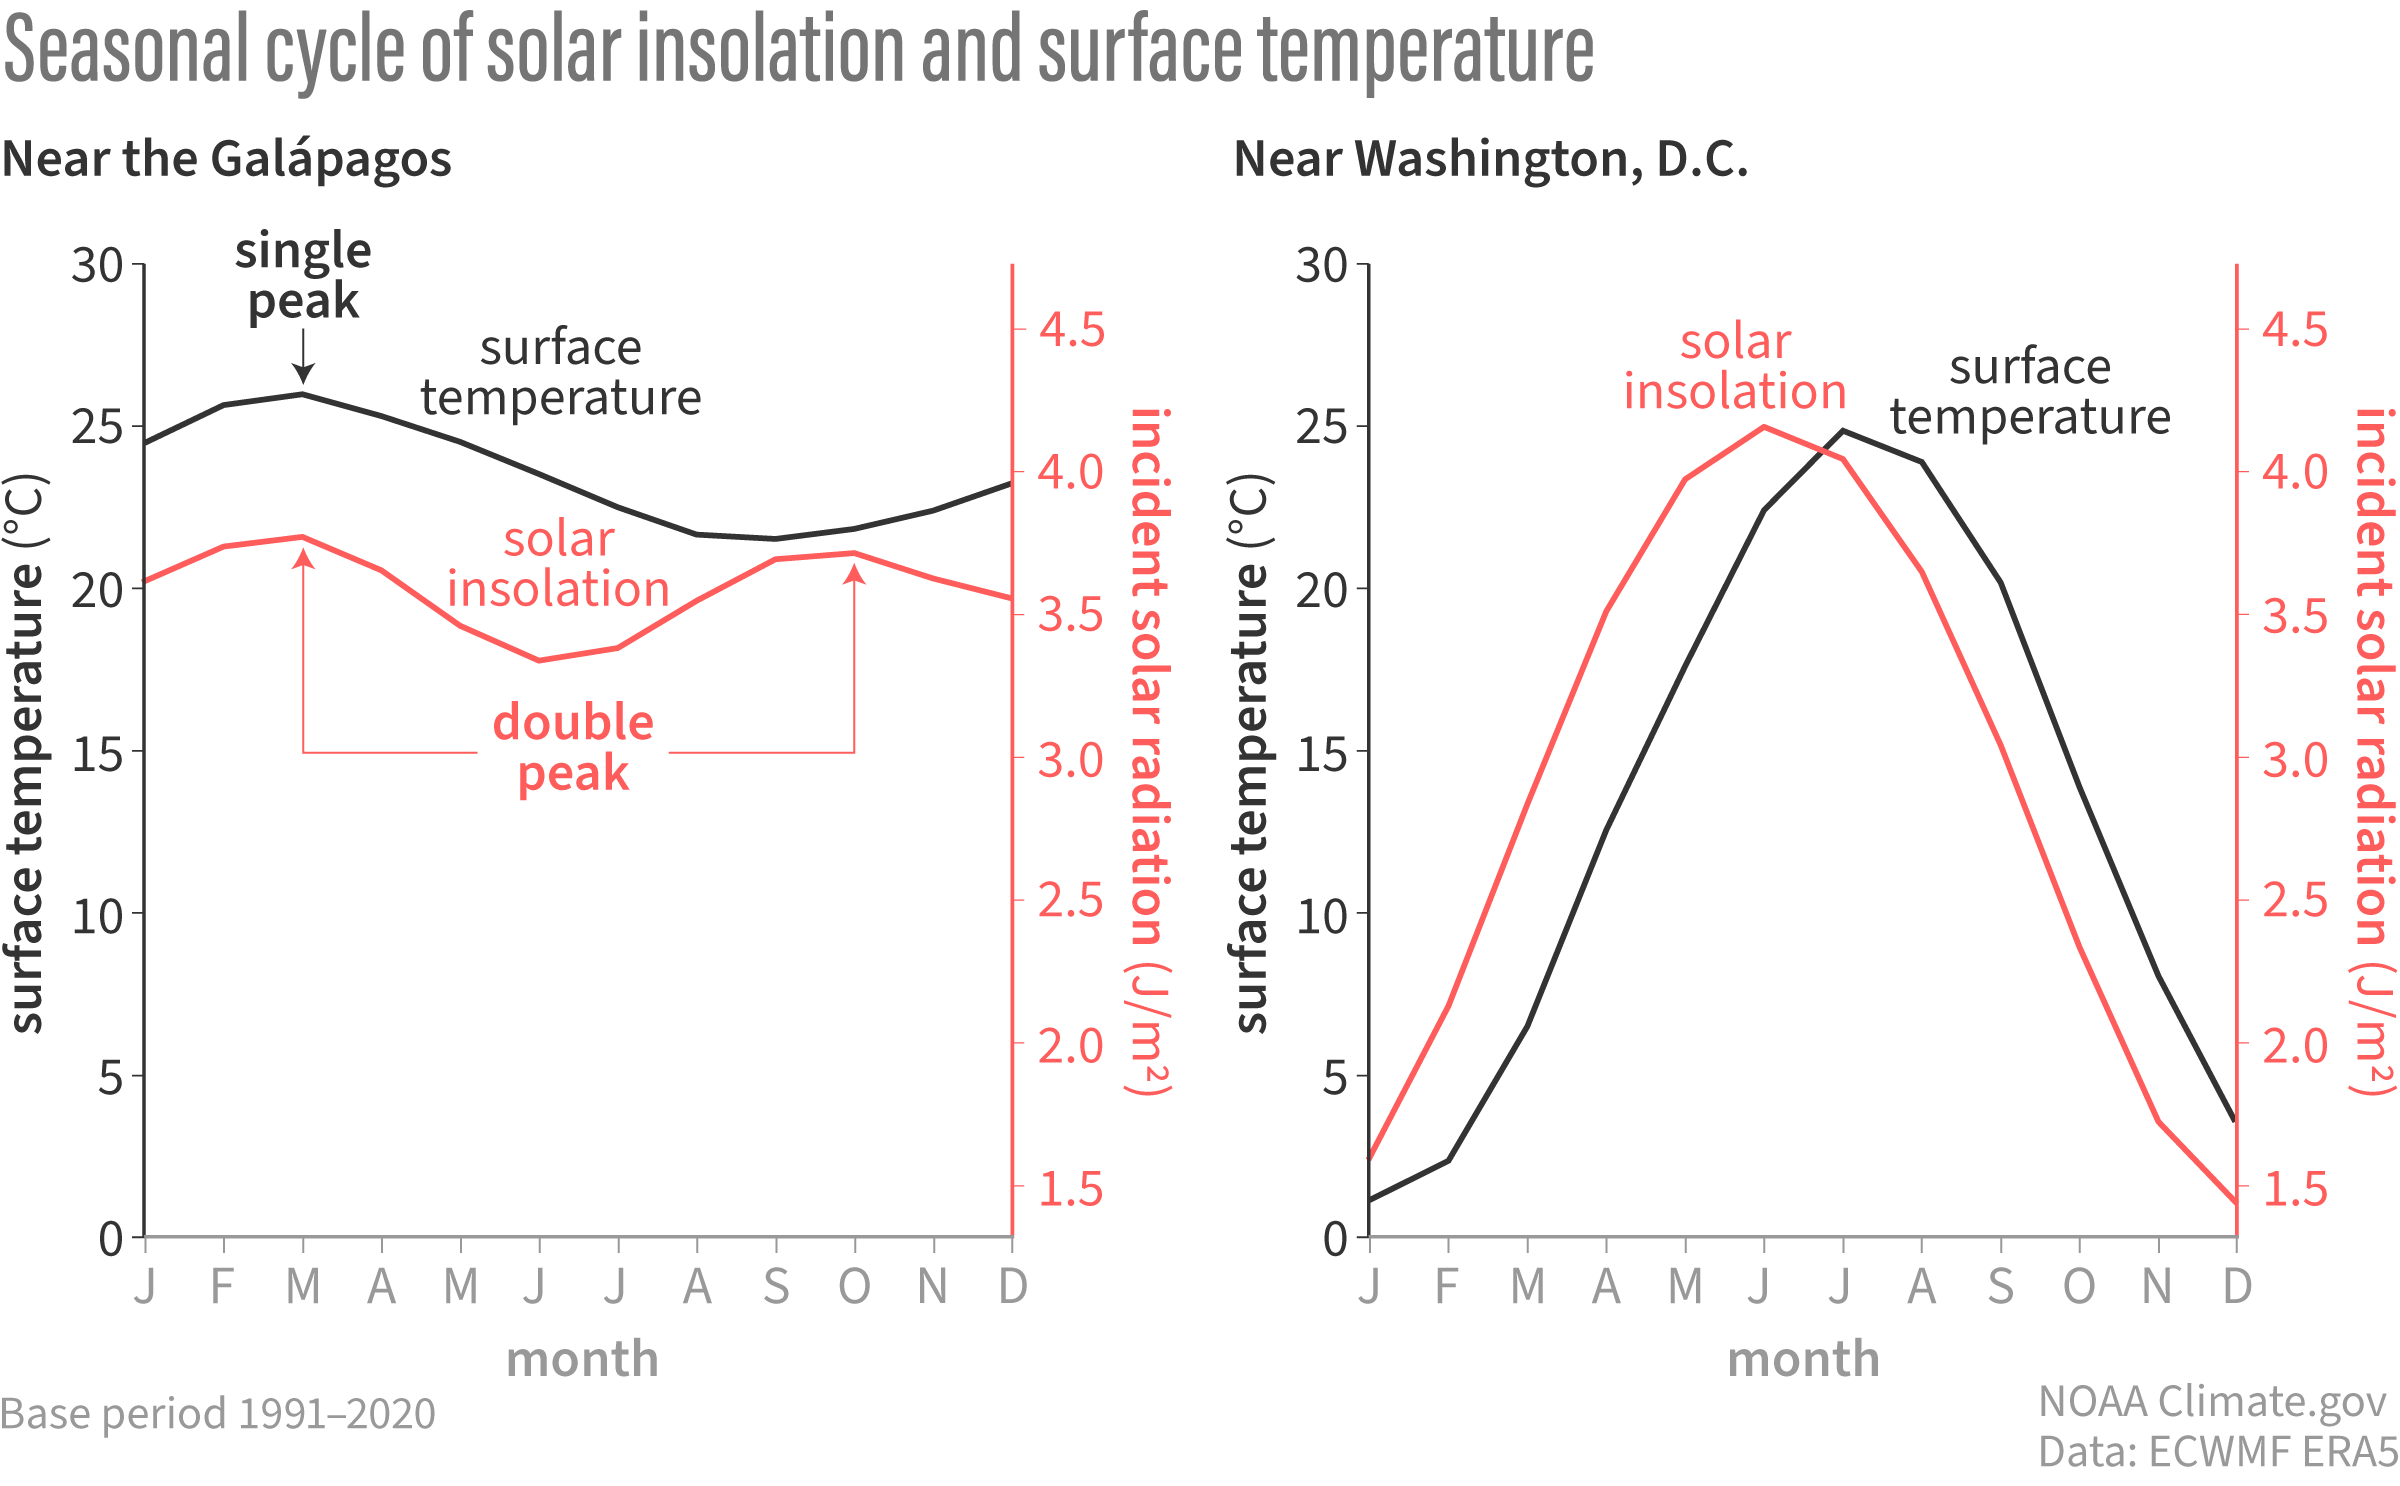
Image caption
Average monthly surface (2-meter) temperature over the 1991-2020 period (black line) and average monthly incident solar radiation at the top of the atmosphere (red line). The values for solar radiation are divided by 10e7. Graphs by Cimate.gov based on analysis by M. L'Heureux.