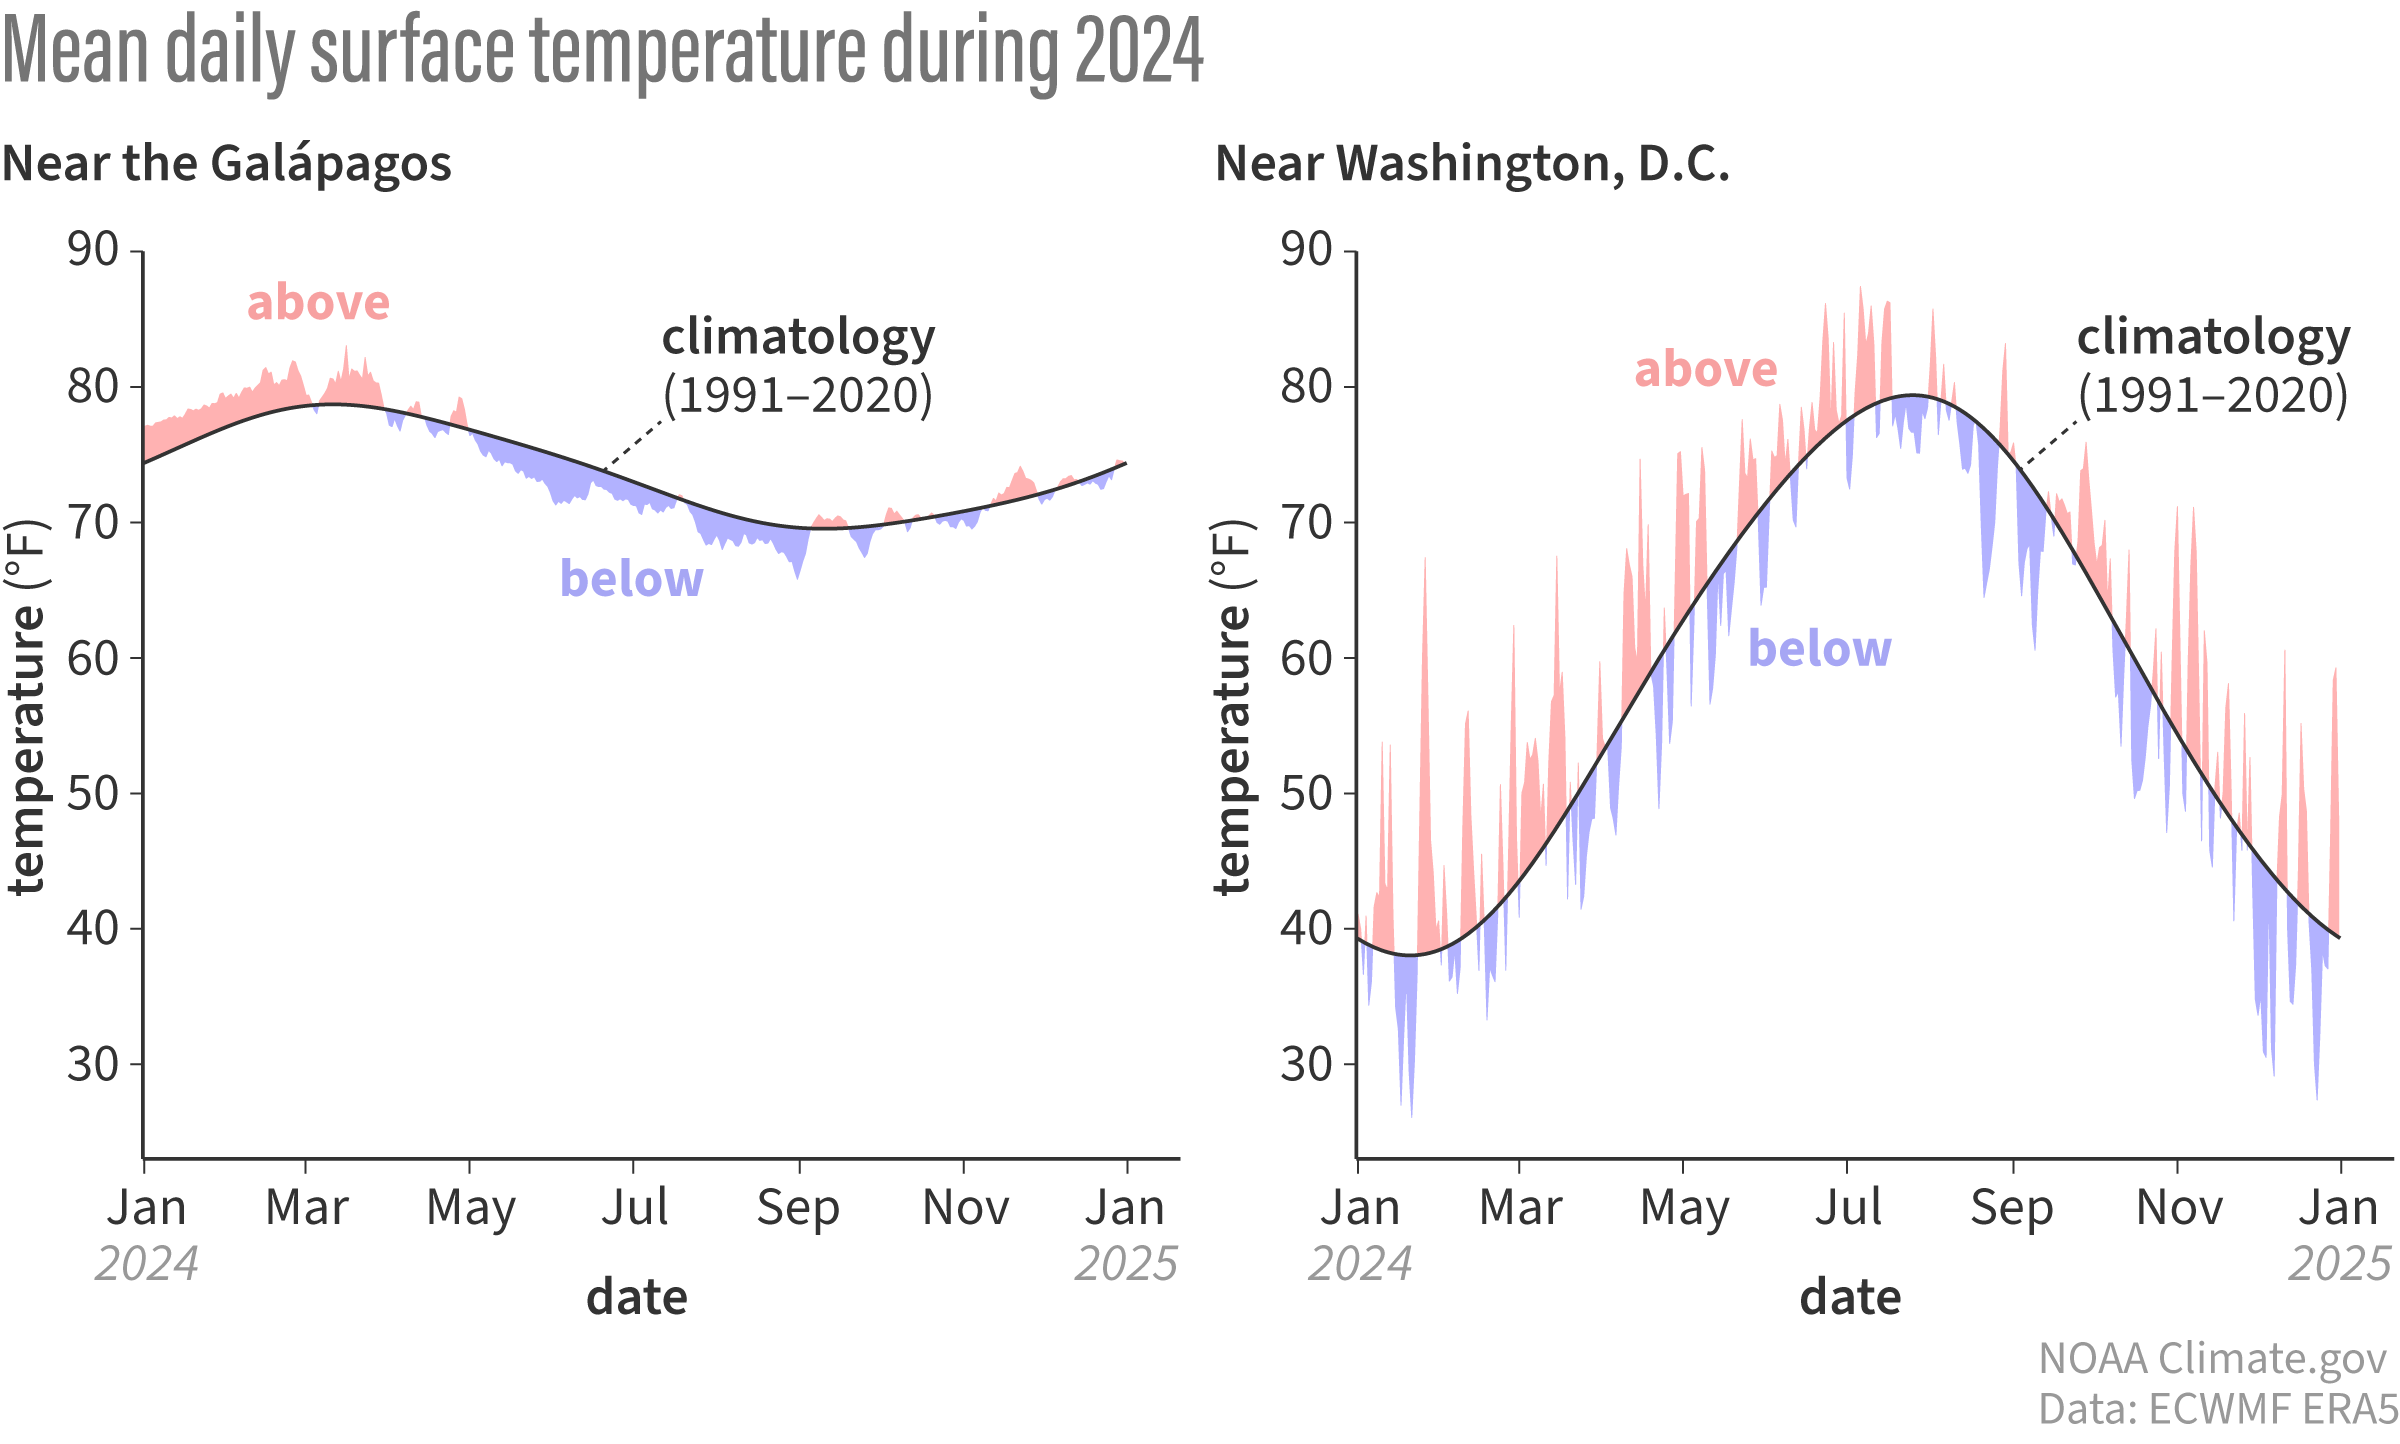
Image caption
Average daily surface (2-meter) temperature during 2024 (in shading) and for the 1991-2020 climatology (black curve). Daily averages are formed by averaging 0, 6, 12, 18 UTC (coordinated universal time) hourly data. The climatology curve is smoothed using the first three harmonics. Graphs by Climate.gov based on analysis by M. L'Heureux.