The National Snow and Ice Data Center (NSIDC) reports that Antarctic sea ice likely reached its annual minimum extent on March 1, 2025, five days later than the 1981-2010 average. The 2025 summer minimum extent is statistically tied with 2022 and 2024 for second-lowest in the 47-year satellite record, which began in November 1978. The record-lowest summer minimum occurred in 2023.
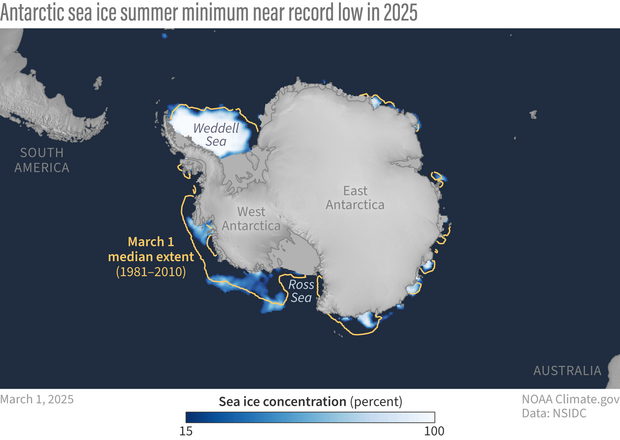
On March 1, 2025, sea ice concentration around Antarctica ranged from 15 percent (medium blue) at the margins of the ice pack to 100 percent (solid white) near the Antarctic Peninsula. The yellow line shows the location of the median ice extent on March 1. Median means “in the middle,” or halfway between the smallest and largest extents on record. NOAA Climate.gov image, based on data from the National Snow and Ice Data Center.
NSIDC reports that the five lowest Antarctic summer minimum extents on record have occurred since 2017, and the four lowest extents have occurred since 2022, with minimum extents for 2022, 2024, and 2025 all statistically tied for second lowest. NSIDC further calculates that Antarctic sea ice is now declining at a rate of 2.6 ± 3.3 percent per decade in February, the typical month of the Antarctic minimum.
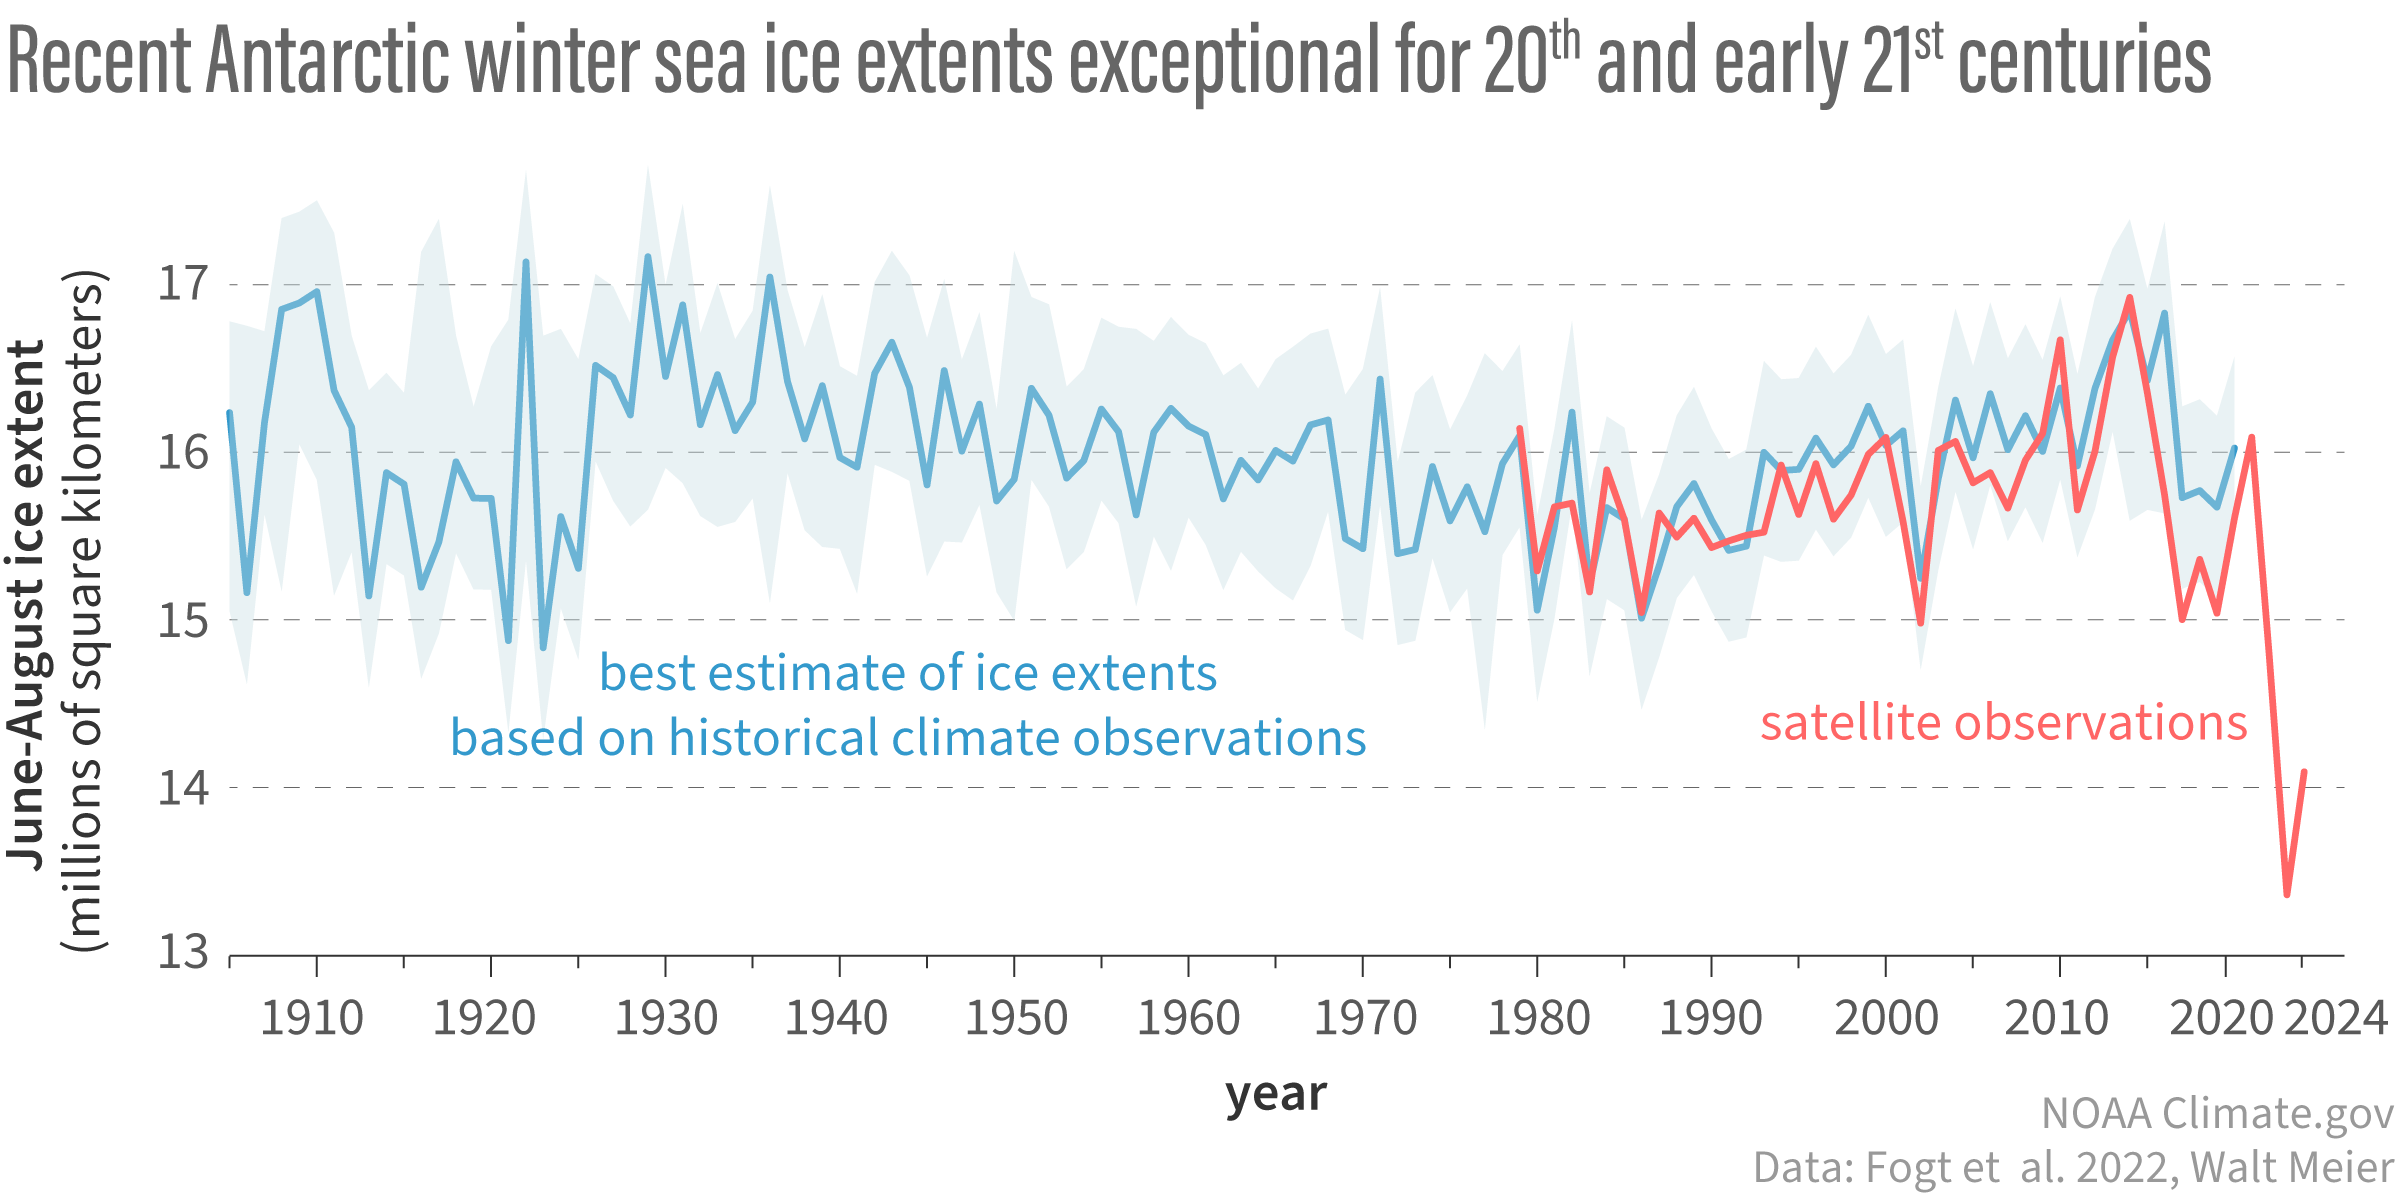
But despite this string of low extents, the downward Antarctic sea ice trend remains small compared to year-to-year variability. (“Not statistically significant” is how scientists put it.) A decade ago, in fact, the annual trend was slightly positive, and in September 2014, Antarctic sea ice reached its highest winter extent in the satellite record. Then in 2016, Antarctic sea ice began exhibiting mostly below-average extents, including 2023’s record-low summer minimum and winter maximum.
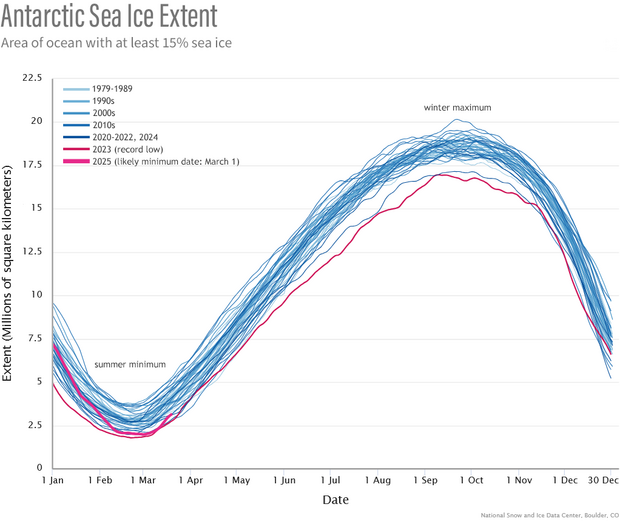
Each line on this graph shows the daily sea ice extent around Antarctica for each year since 1979. Extent means “the total ocean area that is at least 15% ice covered” based on satellite data. Years are color-coded by decade: earlier years are lighter blue, and more recent years are darker blue. Unlike the graph for the Arctic over the same period, this graph does not show a clear downward trend over time. The line for 2025 to date, which reaches a near-record low, is bright pink. The line for 2023 (the record-low extent) is a darker shade of pink. NOAA Climate.gov graph, based on data from National Snow and Ice Data Center.
Ted Scambos, a research scientist at the Cooperative Institute for Research in Environmental Sciences, describes Antarctic sea ice behavior as “frustratingly fickle—still able to drift toward near-normal conditions and then almost as quickly return to the below-average trend that has been the rule since 2016.”
Scambos stresses that it's too soon to know for certain whether the recent low extents of Antarctic sea ice are the emergence of a response to long-term global warming. Like the extreme highs of the previous decade, the extreme lows of the recent past may simply be part of the region’s natural variability.
Still, the recent extreme lows, so far outside the range of observed variability, have attracted scientific attention, and scientists have pondered whether Southern Hemisphere sea ice has entered a new state. In our story about 2024’s near-record low winter ice extent, NSIDC ice expert Walt Meier said, “I think it is still too soon to say for sure that we’re witnessing global warming coming to Antarctic sea ice, but if it were to be the case, this is what it would look like.”
If Southern Hemisphere sea ice remains consistently low over the next decade or so, experts say, the answer will become much clearer.