Blogs
At the beginning of this month, we find ourselves looking at conditions in both the ocean and the atmosphere that appear a bit like El Niño. Sea surface temperature anomalies in the Niño3.4 region have been at or above +0.5°C for the last few months, and the forecast calls for a 50-60% chance the Niño3.4 index will remain above +05°C through the late winter and into spring. However, we still haven’t checked the box saying we have “El Niño conditions.” Why not?
Mostly, it's because even though there are some promising signs that the atmosphere may be responding to the warmer equatorial Pacfic, we've seen a lot of fluctuations over the past year. It will take more than a couple of wee…
Read article

Some people have probably noticed that over the past year, this blog has mentioned several different ways to measure and monitor ENSO—whether we are in an El Niño, La Niña, or neither. At NOAA, the official ENSO indicator is the Oceanic Niño Index (ONI), which is based on sea surface temperature (SST) in the east-central tropical Pacific Ocean. But we have also mentioned other ways of measuring ENSO. Here, we will review some of them and then provide reasons why several different indicators are best for monitoring ENSO.
Historically, an index has been a common way to summarize the ENSO status. An index is a number scale in which all the individual factors needed to describe a complicated …
Read article
*Okay, maybe not.
While not as popular as “polar vortex,” oceanic Kelvin waves did break into media reports in early 2014 (here, here, here) when a really strong wave traveled eastward across the tropical Pacific Ocean. In this post, we’ll go into a little more detail on what these waves are and why they are important in ENSO prediction. And if Kelvin waves ever get as popular as the polar vortex some day, we are confident our readers will be able to describe them in a way that doesn’t generate a heavy sigh from scientists.
Not all waves curl and crash
The waves that most of us are familiar with are the waves at the beach—waves that e…
Read article
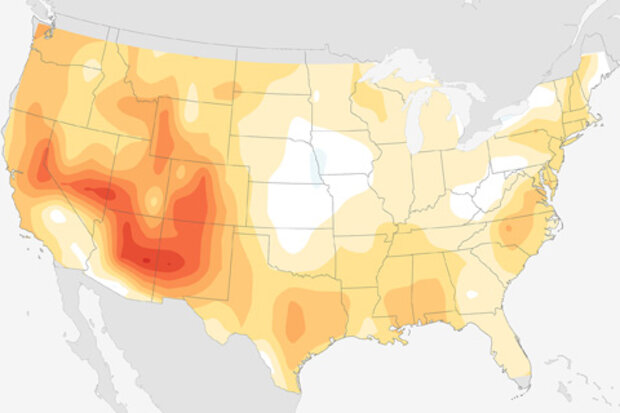
In my last post, I showed the last ten years’ worth of December through February (DJF) winter forecasts and observations (2004-2013) and allowed our eyes to tell us their thoughts on just how well those forecasts did. It appeared that some forecasts were better than others, but there was a wide mix of forecast performances not only from year to year, but from place to place. It was hard to tell, on average, how well the forecasts did.
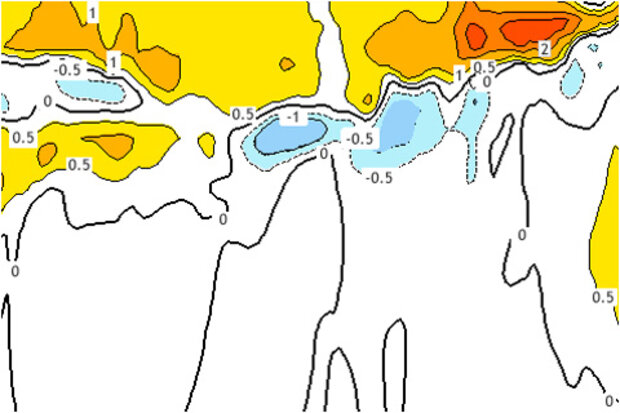
“Eyeballing” the difference between a forecast and observations, while easy, is subjective and potentially inaccurate, in the end. We need verification metrics – statistical analyses that boil down everything our eyes see into numbers—to really put for…
Read article
A month ago, I wrote about the factors we look for when declaring the presence of “El Niño conditions.” Last month we were close: monthly average sea surface temperature anomalies in the Niño3.4 region were above +0.5° Celsius, and they looked to stay that way for at least another few seasons.
However, signs that the atmosphere was responding to the warmer-than-average ocean waters were inconclusive, and we decided to hold off on declaring the presence of El Niño conditions for the moment. Was that the right decision? Why is this particular forecast so difficult? This month, I’m going to take you behind the scenes, into the forecast process.
The CPC/IRI ENSO* team currently consists of…
Read article