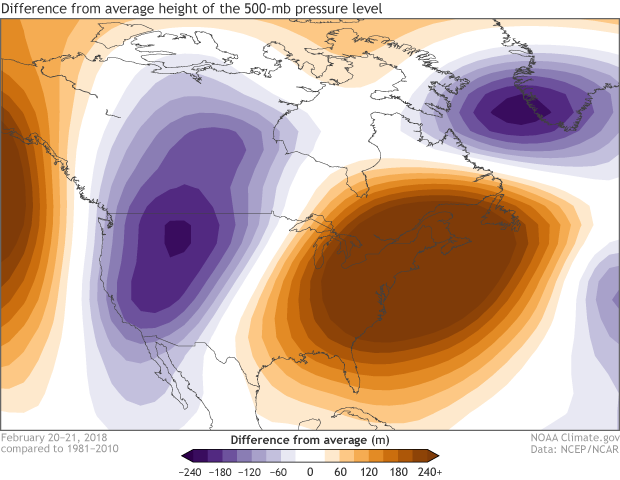
Image caption
500-mb height anomalies over the United States for February 20-21, 2018. Positive height anomalies (oranges) correlate with warmer than average surface temperatures, while negative height anomalies (purples) correlate with colder than average temperatures. During the period, record-breaking warm temperatures were observed over the eastern United States. NOAA Climate.gov map, based on NCEP/NCAR Reanalysis data.