
Image caption
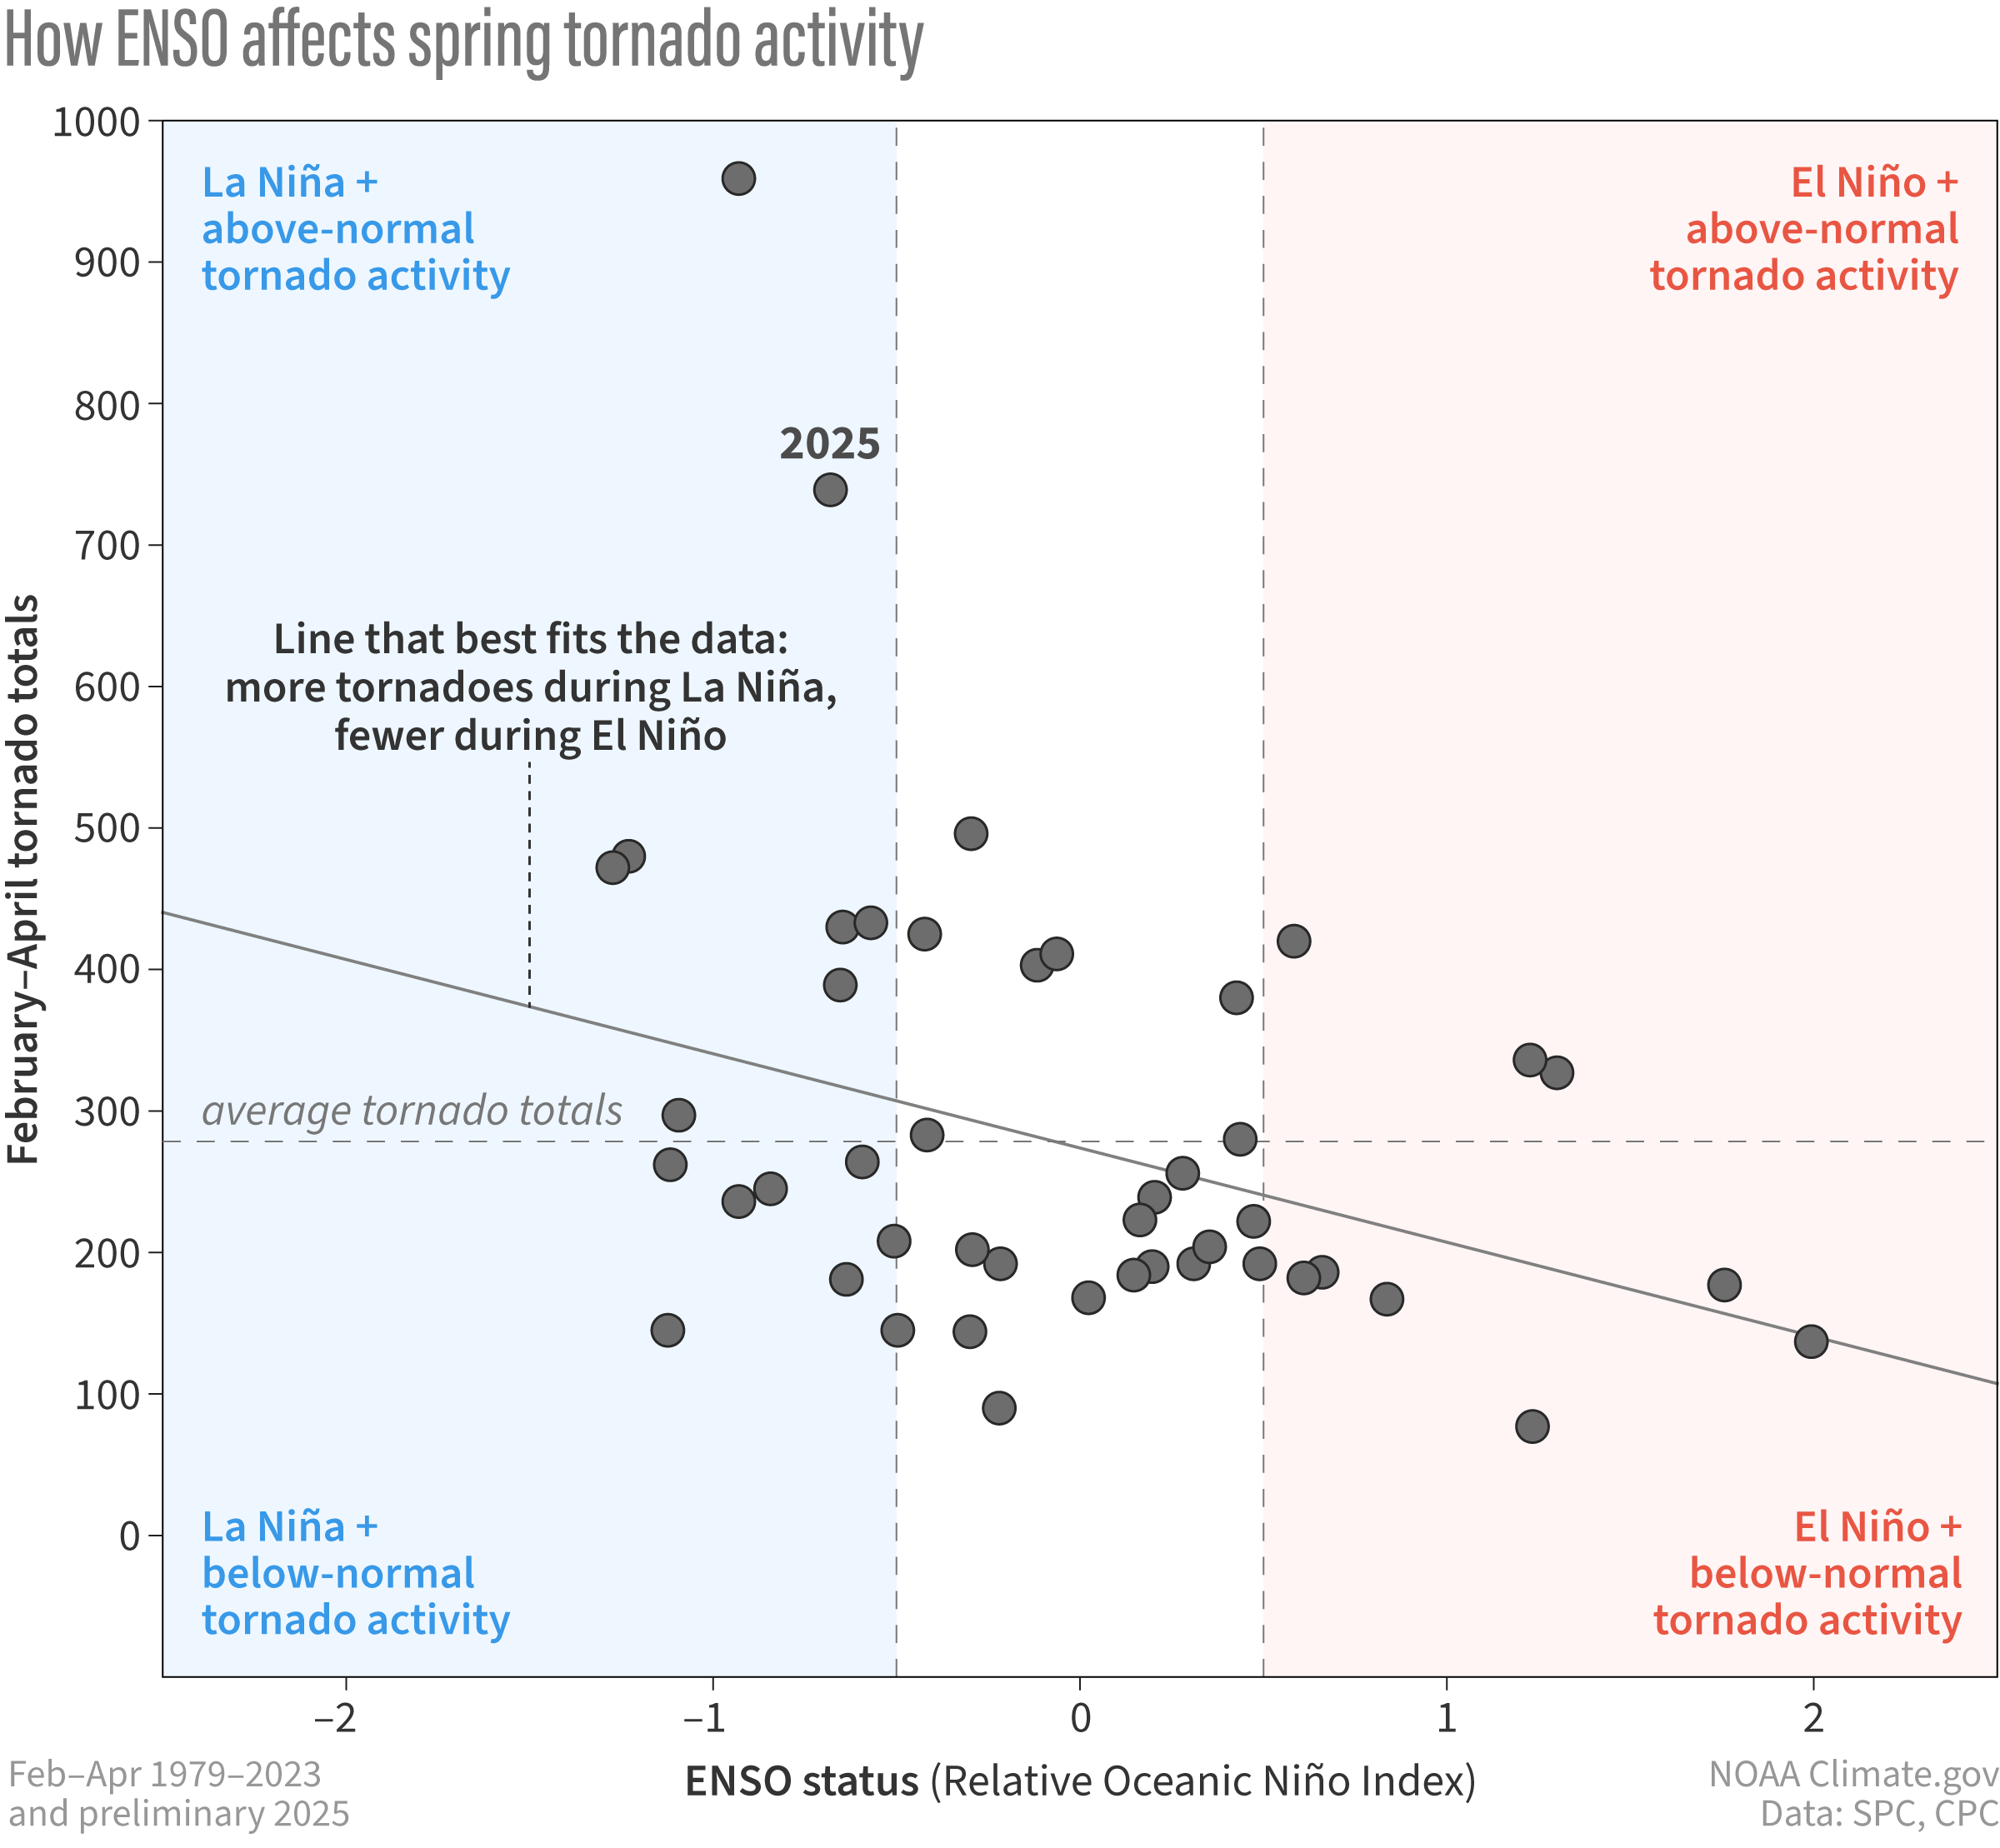
Seasonal tornado activity (height on the vertical axis) for each February-April from 1979-2023 versus the state of ENSO (La Niña on the left, El Niño on the right) based on the Relative Oceanic Niño Index. NOAA Climate.gov graphic, adapted from original by Kelsey Malloy.