
Image caption
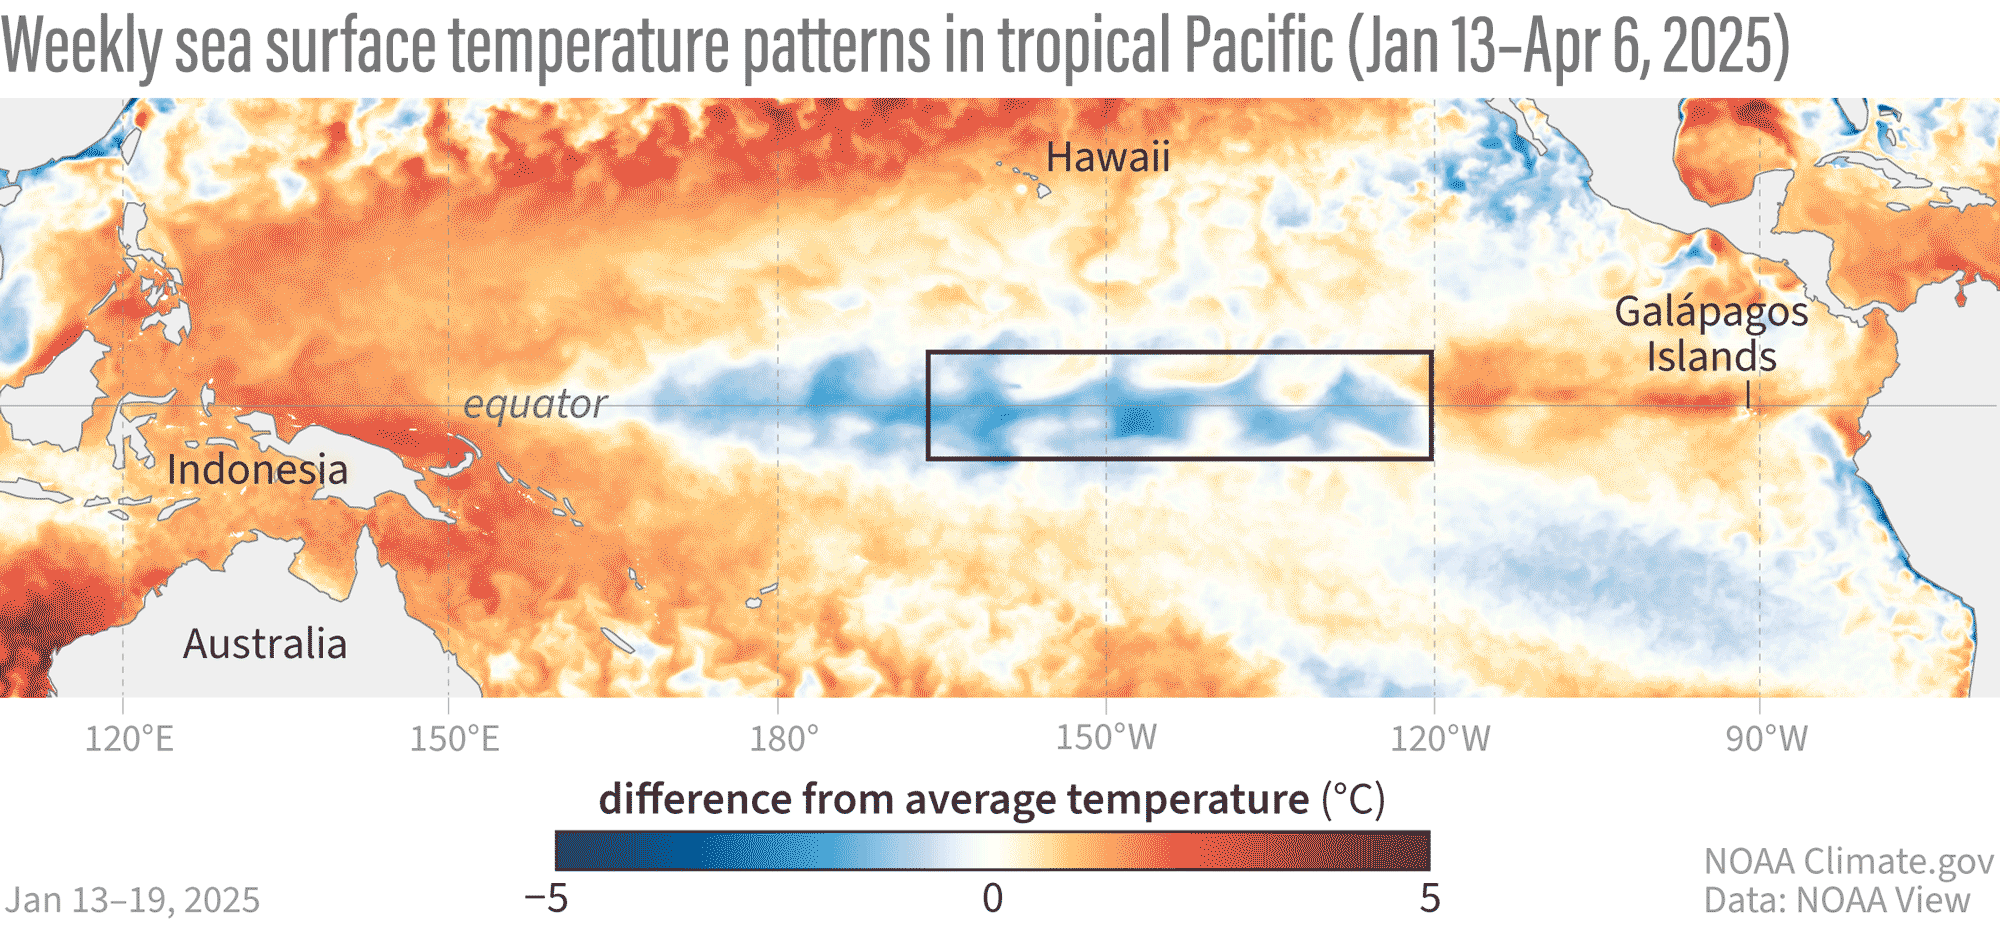
This animation shows weekly sea surface temperatures in the Pacific Ocean compared to average for late January through early April 2025. Orange and red areas were warmer than average; blue areas were cooler than average. La Niña's cooler-than-average sea surface temperatures in the key ENSO-monitoring region of the tropical Pacific (outlined with black box) have dissipated in recent weeks. NOAA Climate.gov animation, based on Coral Reef Watch Data and maps from NOAA View.