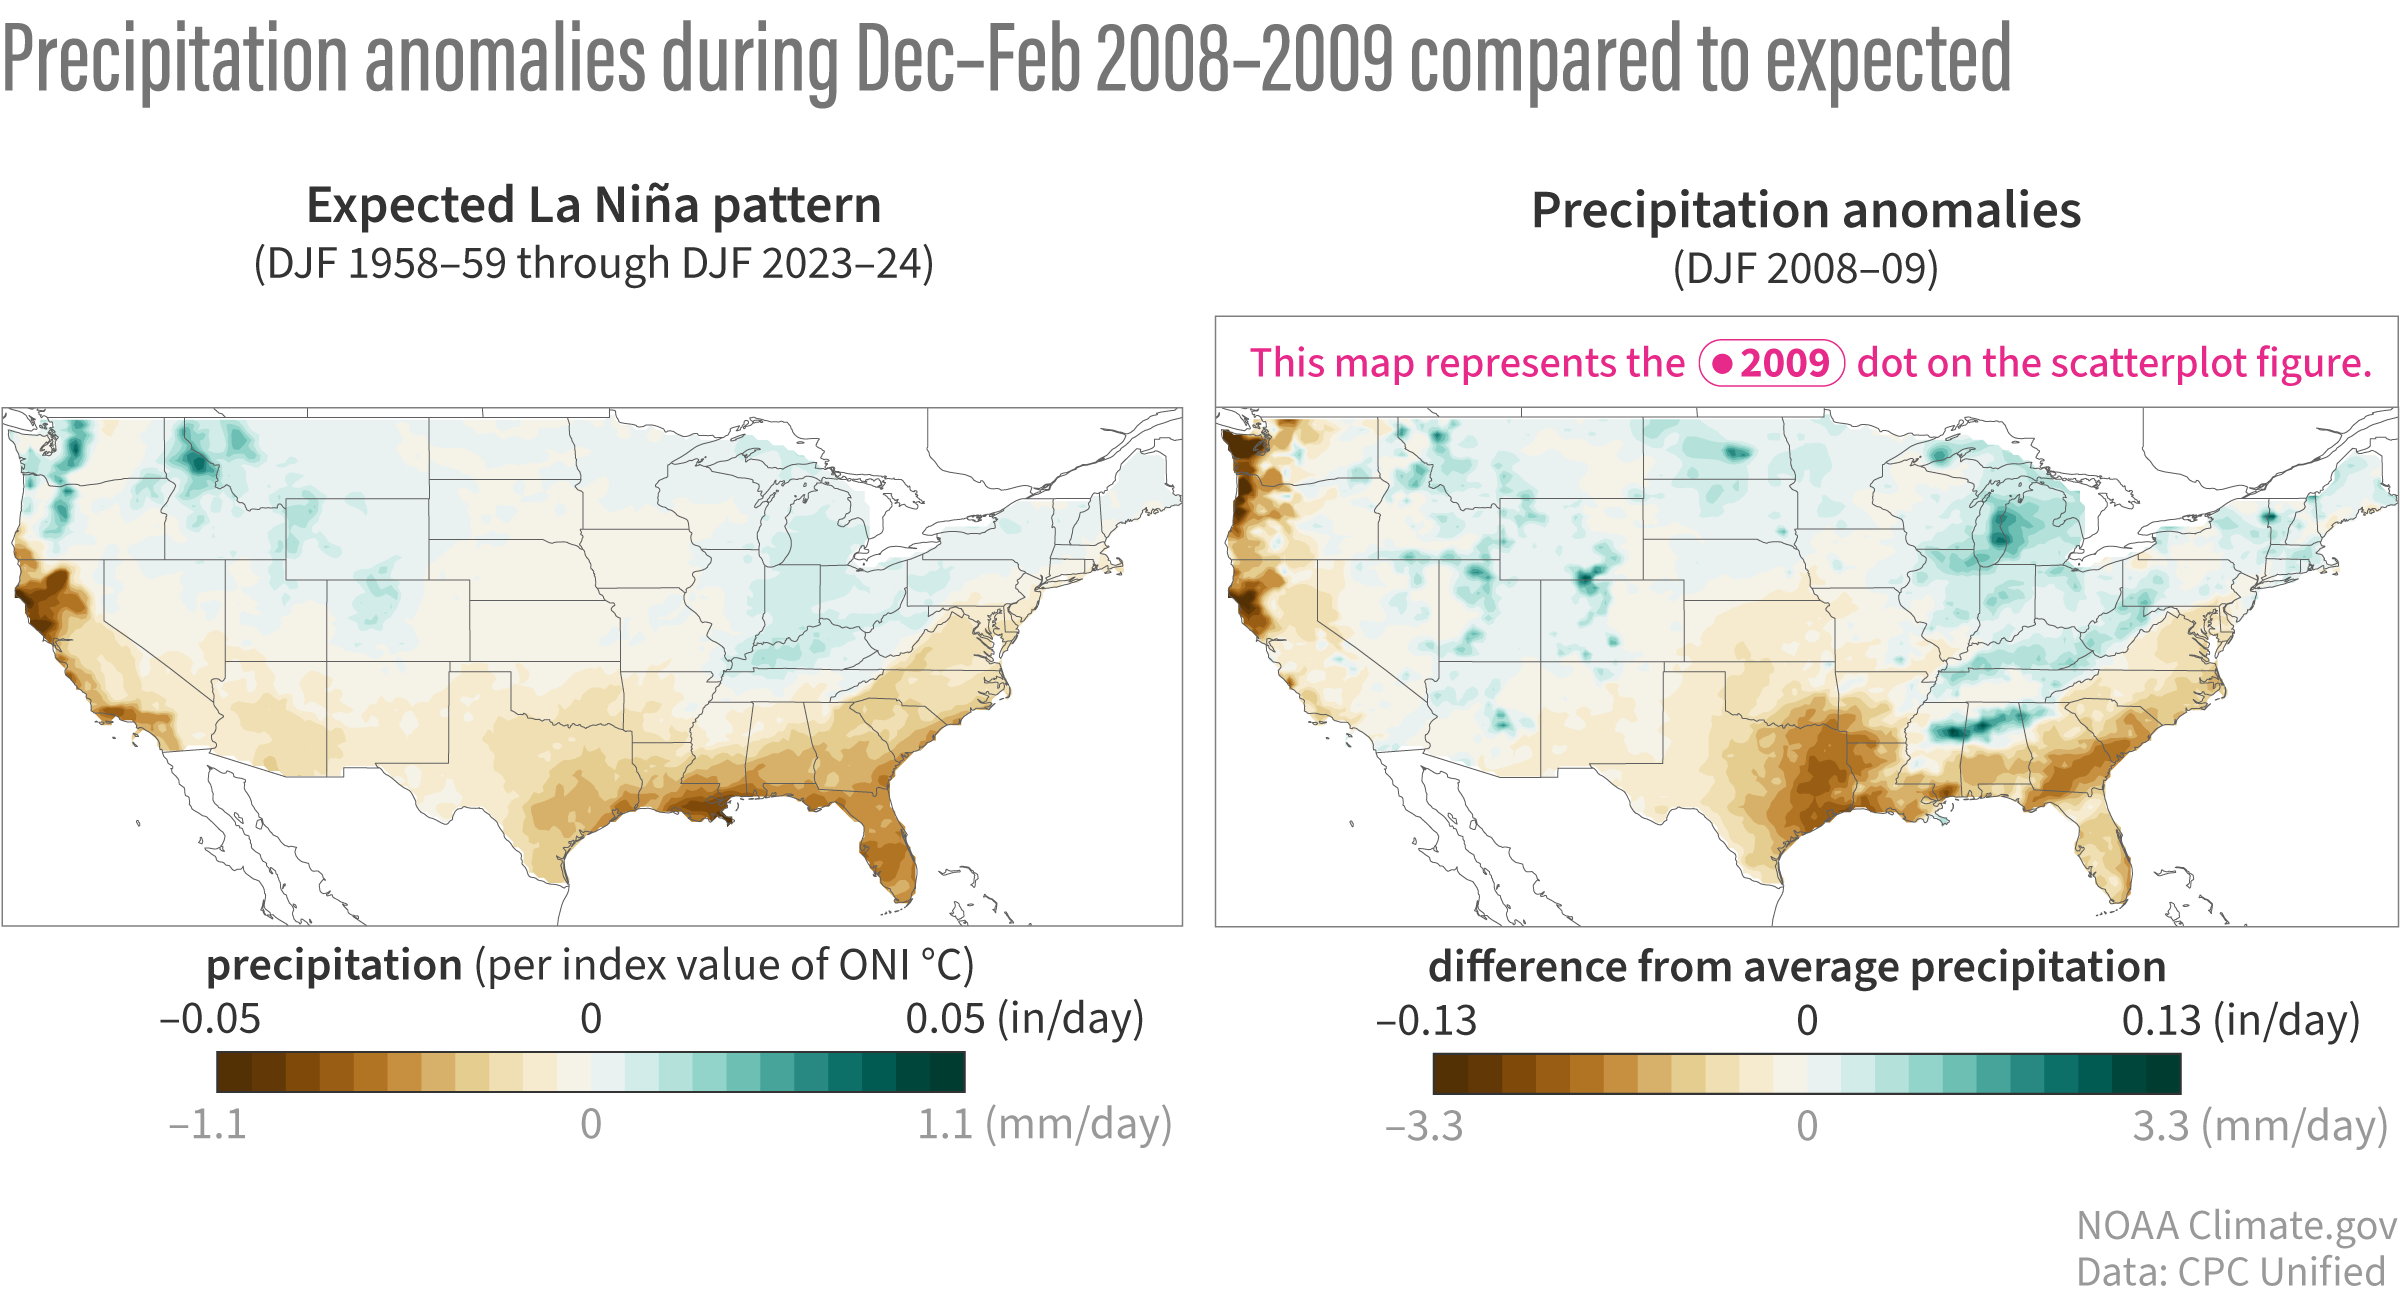
Image caption
The 2008-09 winter precipitation anomaly pattern that had the most negative match score in the 1959-2024 record. This winter therefore had the best overall resemblance with the expected La Niña precipitation anomaly pattern. The left panel reproduces the expected La Niña precipitation anomalies based on past winters from 1959-2024. Green shading shows where conditions are expected to be wetter and brown shading shows where it is expected to be drier. Map by climate.gov based on analysis by M. L’Heureux (reference).