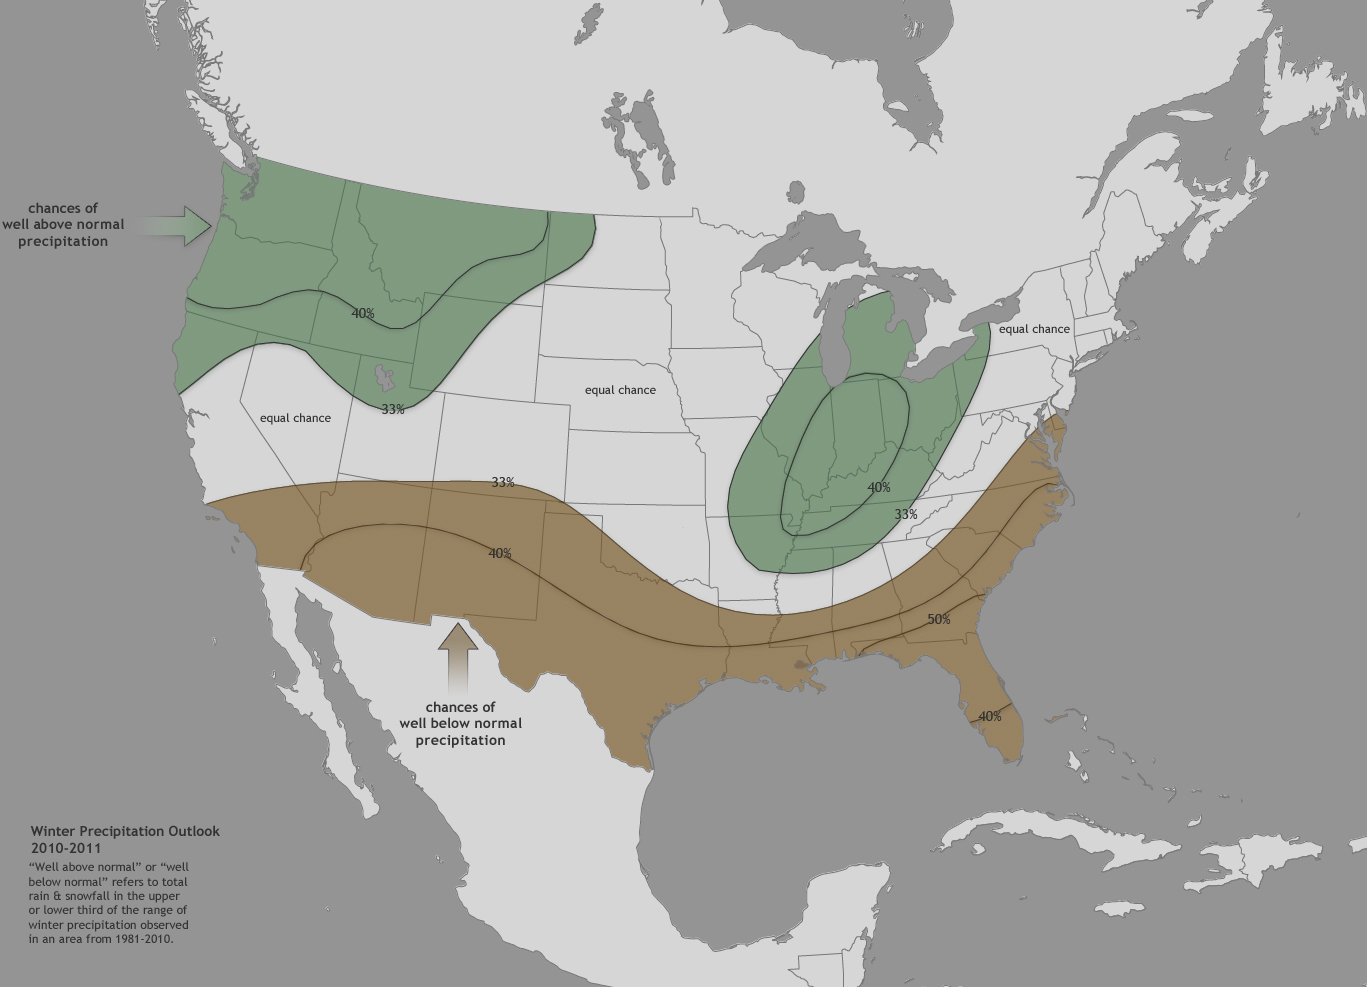
Image caption
Colored shading shows areas where precipitation was predicted to be well above or well below normal. Contour lines show the level of probability. (Outside of the shaded areas, the forecast called for equal chances of above normal, normal, or below normal conditions.) NOAA maps by climate.gov team, based on data provided by NOAA's Climate Prediction Center.