
Image caption
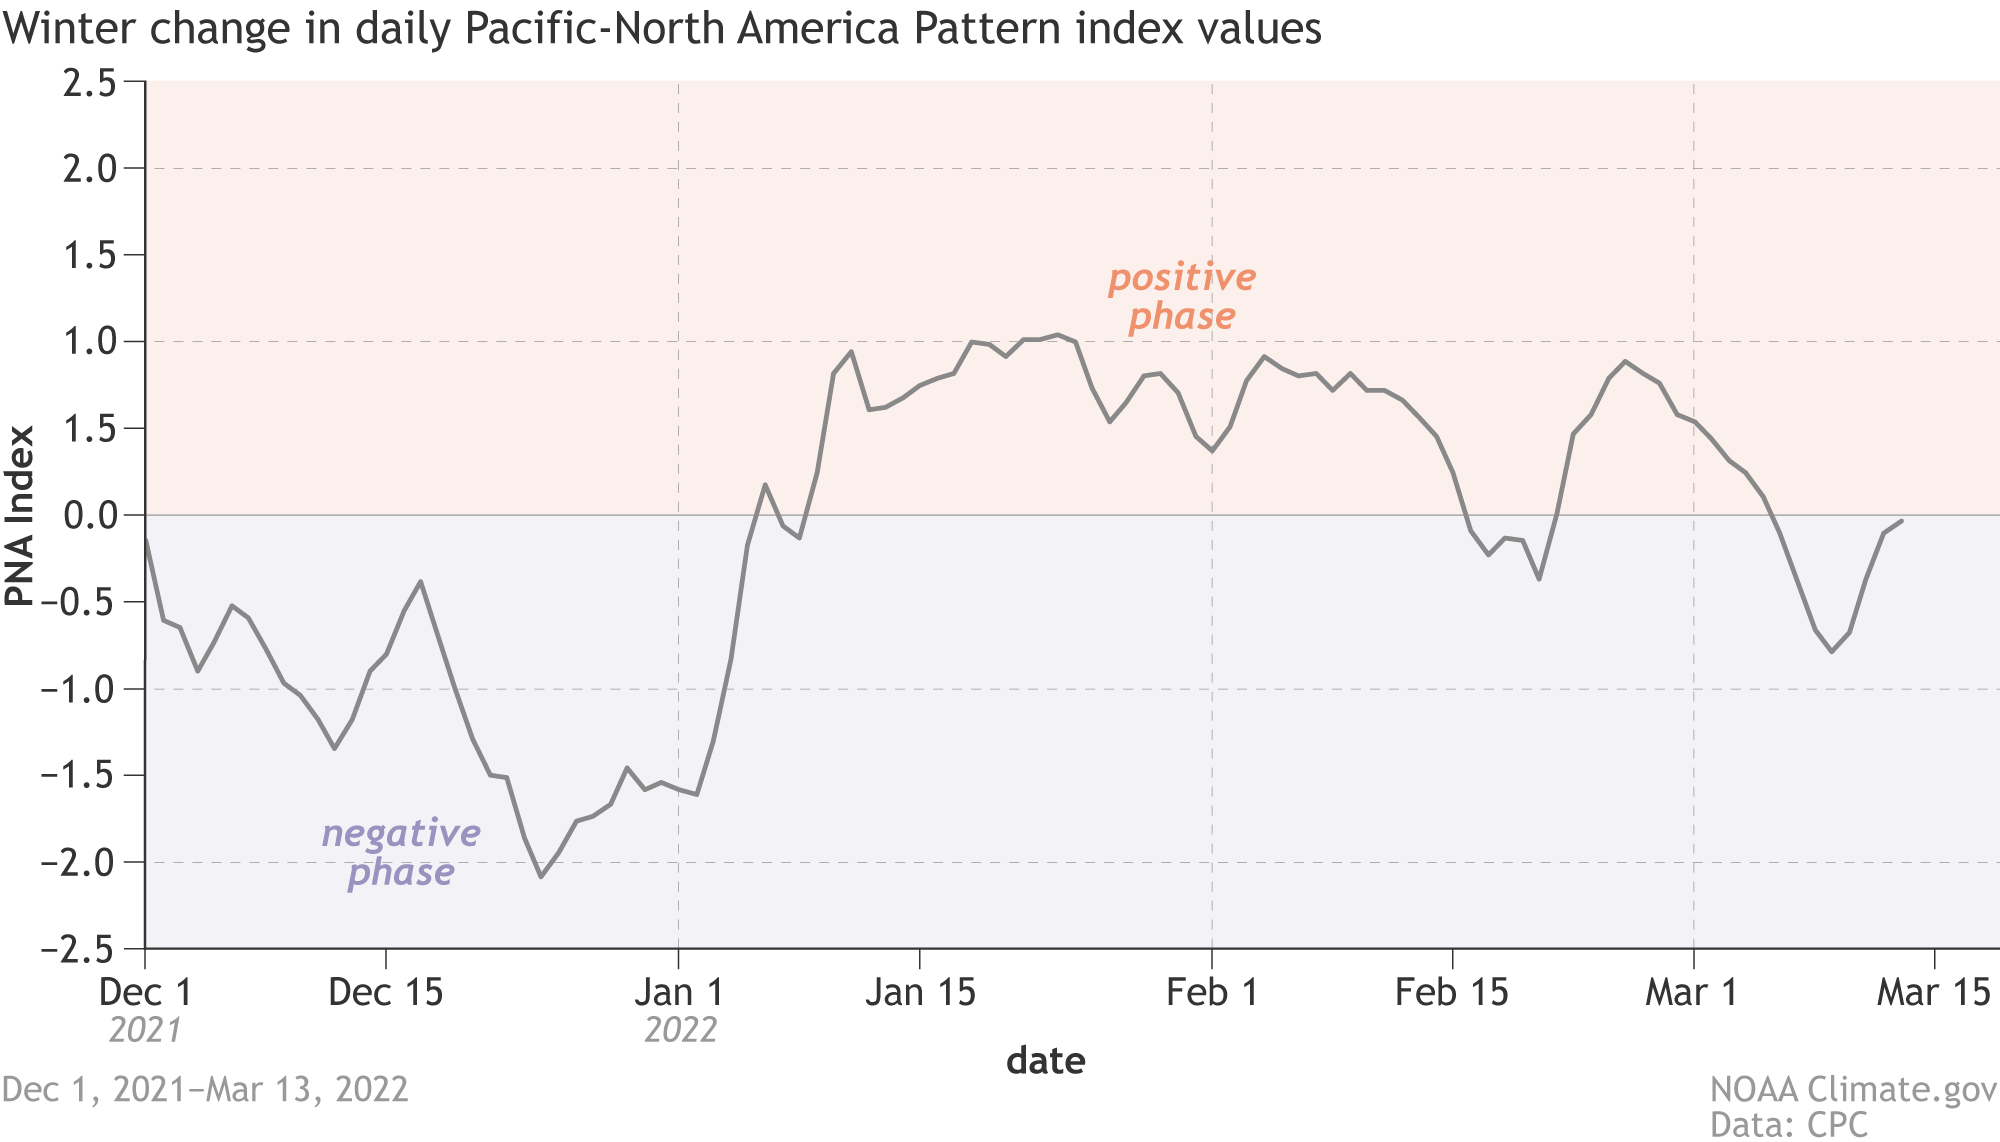
The daily Pacific North American (PNA) Pattern index from December 1, 2021 - March 15, 2022. Positive numbers indicate that the PNA was in the positive phase, while negative numbers indicate the PNA was in the negative phase. There was a shift from a mainly negative PNA in December 2021 to a positive phase PNA in 2022. Climate.gov image using data from NOAA Climate Prediction Center.