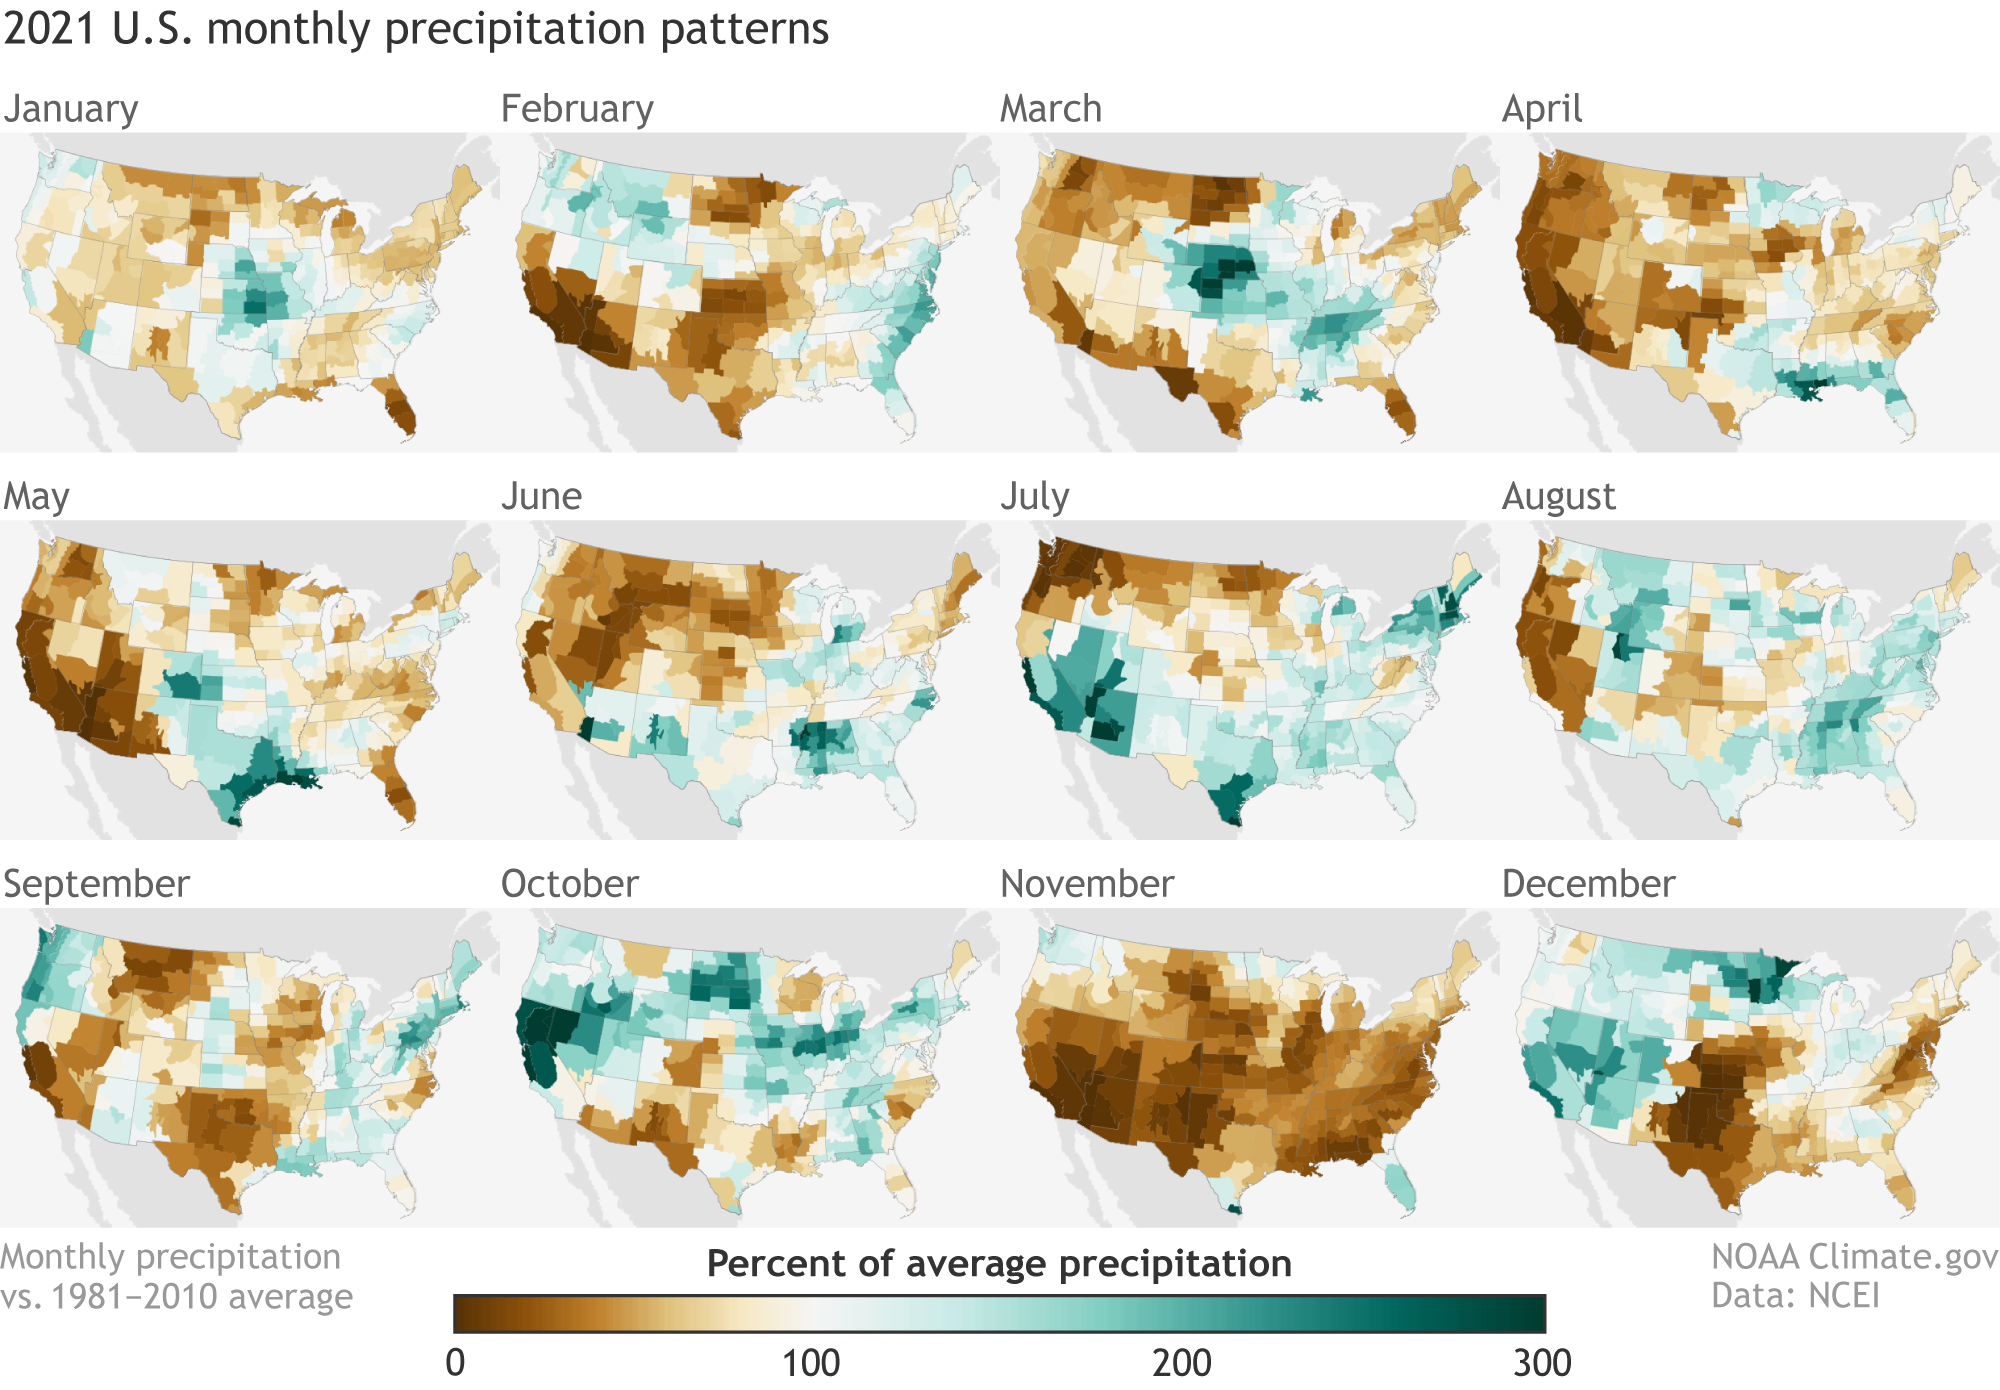
Image caption
Percent of average precipitation across the contiguous United States in 2021 compared to the 1981-2010 average. (Alaska maps.) Places where precipitation was less than 100 percent of normal are brown; places that were up to 200 percent or more above normal are blue-green. Maps by NOAA Climate.gov, based on U.S. Climate Division data from NCEI.