
Image caption
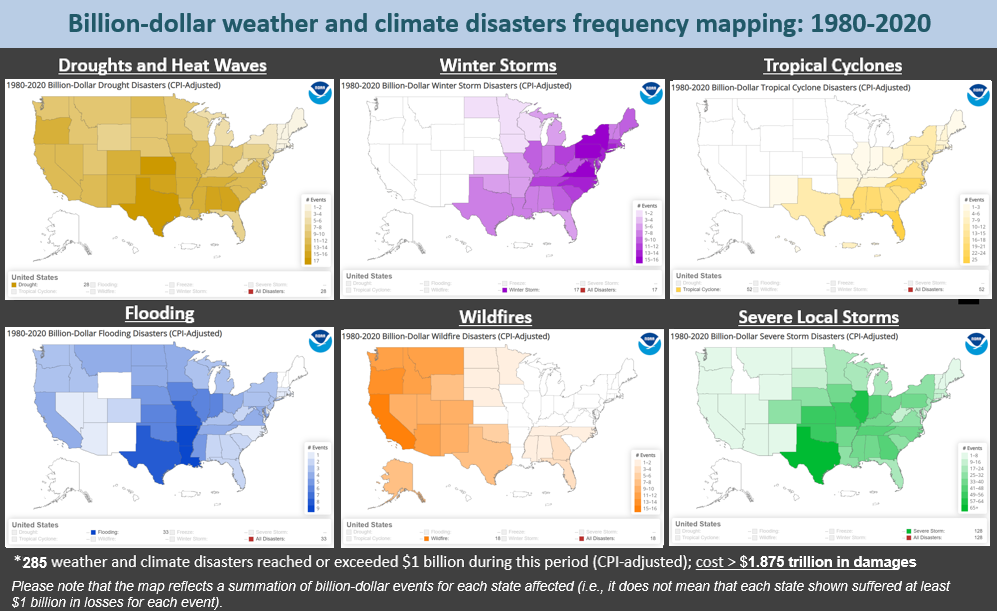
Maps depict the number of times each state has been affected by different types of billion-dollar weather and climate disasters. Note that each state did not necessarily experience a full billion-dollar cost for an event to be counted; it only needed to be part of a regional event that caused one billion dollars or more in direct damages. Image based on screenshots from the NCEI Billion-dollar Disasters webpage.