
Image caption
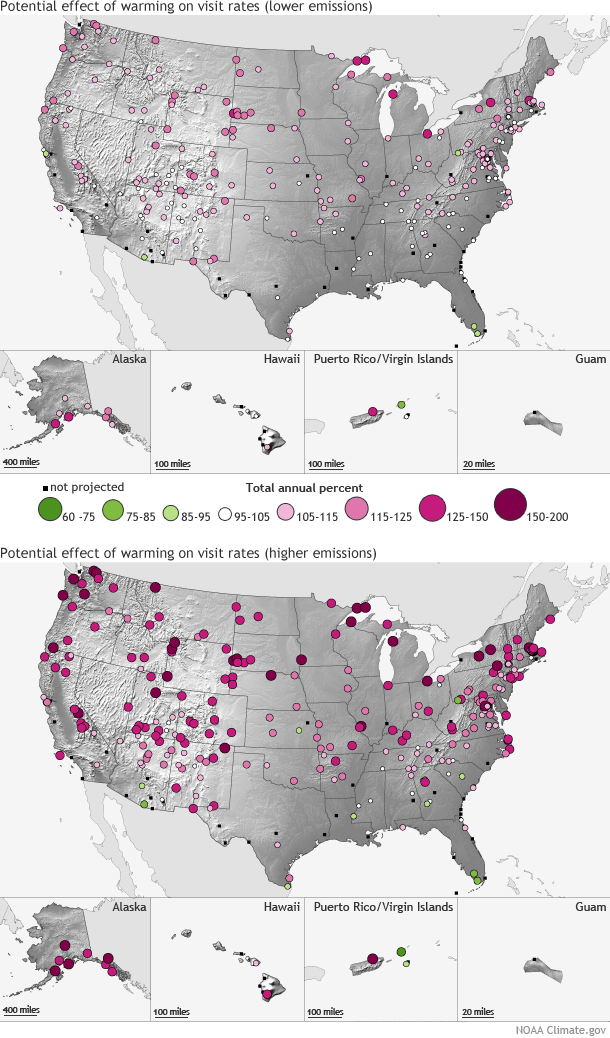
Annual visitation by mid-century (2041–2060) as a percentage of historical values (1979–2013), based on a medium-low greenhouse gas emissions scenario (top) and a higher-emissions scenario (bottom). Black squares are parks where visits were not connected to temperature. NOAA Climate.gov map based on data from Fisichelli et al.