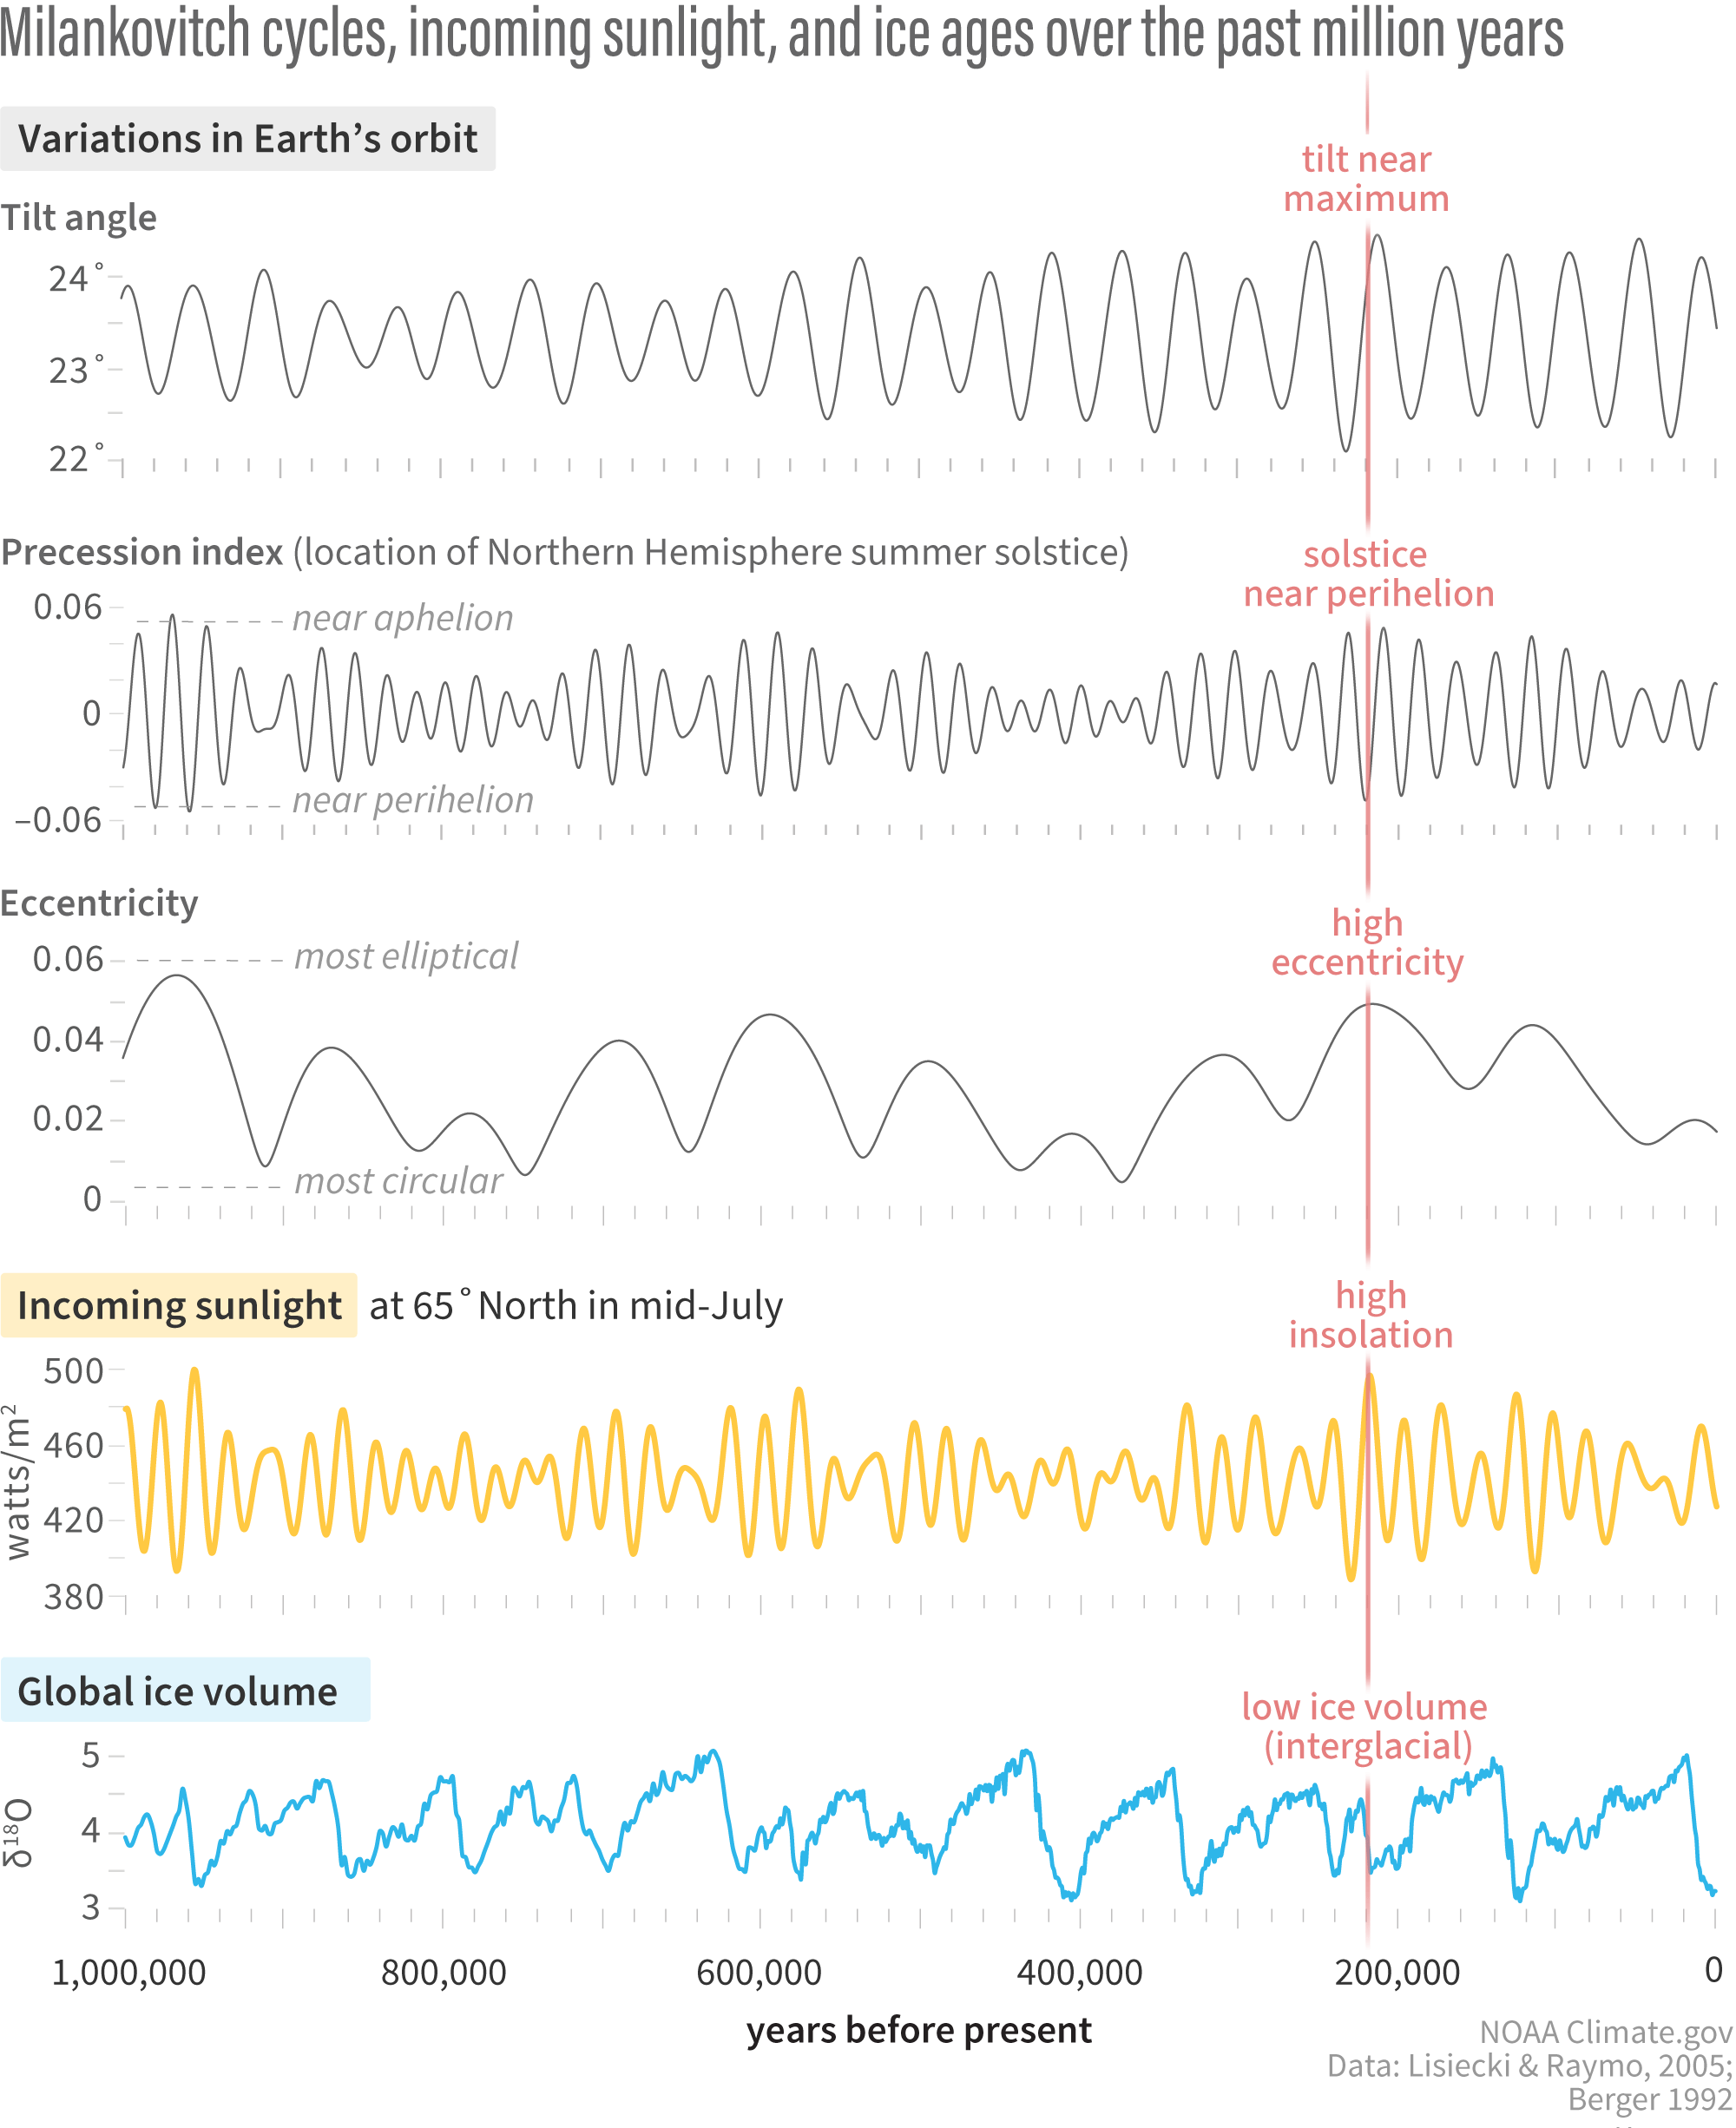
Image caption
(Rows 1-3) Milankovitch cycles—variations in Earth's tilt on its axis, precession, and eccentricity—over the past million years. (Row 4) Incoming sunlight (insolation) during Northern Hemisphere summer. (Row 5) Global ice volume inferred from oxygen isotopes in sea floor sediments. The red line highlights conditions around 220,000 years ago, when overlap among the three orbital cycles brought a peak in Northern Hemisphere insolation, triggering a warming period with low ice sheet volume. NOAA Climate.gov image, based on data from Lisiecki and Raymo 2005 and Berger 1992.